Previous Story
Monday 4th April: Weekly technical outlook and review (UK and Japanese Bank holidays today)
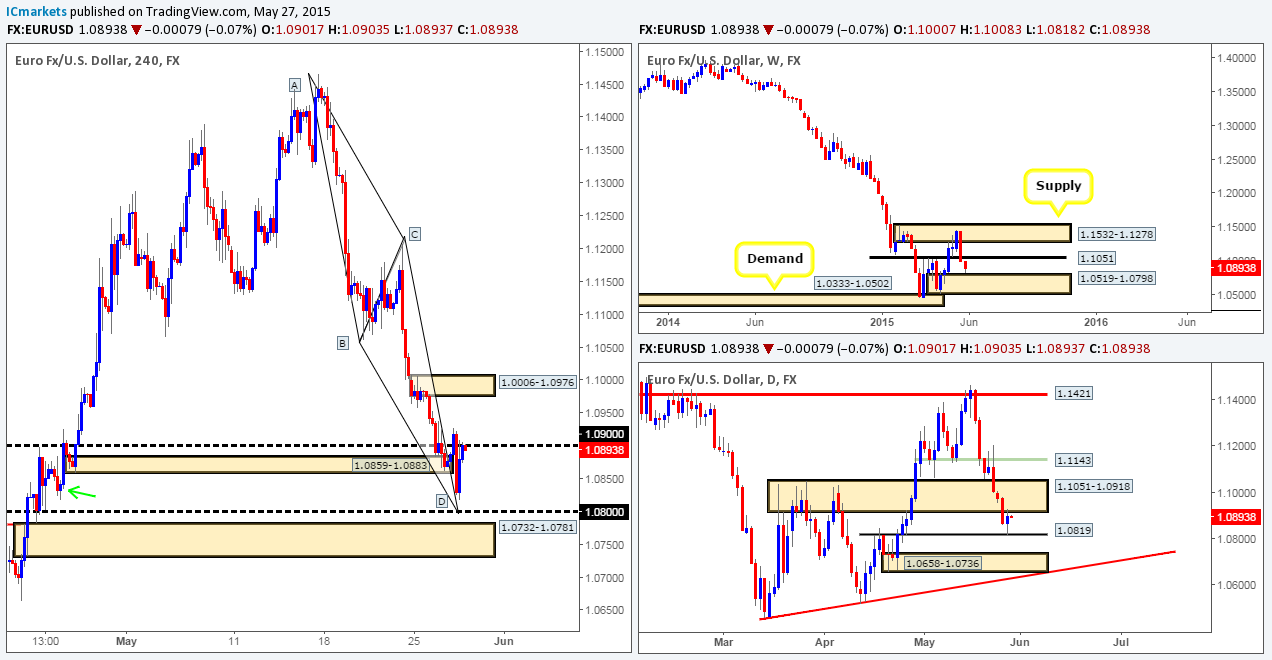
EUR/USD:
Weekly view: Last week’s action saw the Euro rally a cool 330 pips from open (1.0859) to close (1.1192). This move consequently saw price close above the weekly swap level seen at 1.1096, and at the same time, ‘touch gloves’ with a major weekly supply zone coming in at 1.1449-1.1278. This has been the most we’ve seen the Euro rally since price began its descent back in May 2014. In spite of this, our long-term bias still remains south and will continue to do so until we see a convincing push above the aforementioned weekly supply area.
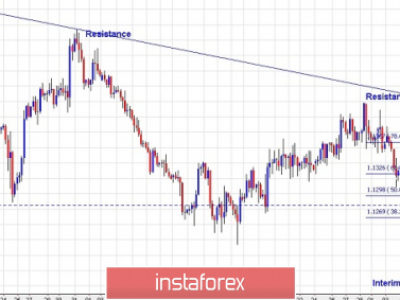
Daily view: The daily timeframe shows some very interesting price action. The Euro broke above a daily supply area seen at 1.1244-1.1158. This move likely triggered buy stops from traders not only attempting to fade this area, but also from those looking to buy the breakout, and thus potentially setting the stage for further upside this week. However, before a rally takes place, we should expect profit taking to hit this pair which will likely force prices to sell off down to the aforementioned weekly swap level, or even the daily swap area seen below it at 1.1051-1.0918. Once/if price should rally this week, there’s a ton of resistance for the buyers to contend with – we have a clear Harmonic Bat pattern reversal zone coming in at 1.1516/1.1376, and a converging daily Quasimodo resistance line seen at 1.1421. Furthermore, let’s not forget that these resistances are located deep within the aforementioned weekly supply area making it one very strong and robust area to watch out for this week!
4hr view: Friday’s sessions saw the EUR/USD pair aggressively sell off from the 4hr swap level 1.1280, consequently forcing prices to attack and close below the 1.1200 number to end the week.
Assuming that the sellers can hold the market below 1.1200 today, this could very well encourage further sellers to join in and push this market south towards the weekly swap level/round number area 1.1096/1.1100. The reason for believing price could drop this far is simply because of the strong buying tail seen marked with a black arrow at 1.1114. This tail likely consumed a ton of buyers when it spiked lower to fill unfilled buy orders, thus any sell off seen in this vicinity should not have much supportive pressure to deal with until reaching the 1.1100/1.1096 area. Therefore, our first port of call today will be to watch for lower timeframe selling pressure around 1.1200, should a sell signal be seen, we’ll look to short this pair down to around the 1.1110 mark. In the event this goes to plan, we intend to close our existing short positions here and begin looking for longs around 1.1100/1.1096 area – the move from this zone could be aggressive as let’s not forget that we’re dealing with the weekly swap level 1.1096 here, so be prepared! Take-profit targets for any longs from this area will be dependent on how price approaches the zone.
Our current buy/sell orders:
- Buy orders: 1.1100/1.1096 [Tentative – confirmation required] (Predicative stop-loss orders seen at: dependent on where one confirms this level).
- Sell orders: 1.1200 [Tentative – confirmation required] (Predicative stop-loss orders seen at: dependent on where one confirms this level).
GBP/USD:
Weekly view: Last week’s action saw price collide with a weekly supply area coming in at 1.5551-1.5391, which, as you can see, saw the GBP sell off 360 pips into the close 1.5133. Consequent to this, a beautiful-looking weekly pin-bar candle took shape in the process – does this mean we should all be looking for shorts this week? Let’s take a look to see what the lower timeframes have to say first…
Daily view: From the daily scale we can see that the rebound from within the aforementioned weekly supply area can actually be pin-pointed to a daily Quasimodo resistance level seen at 1.5478. The move from here saw prices aggressively take out a daily swap area seen at 1.5298-1.5208, which could suggest further downside may be in store this week at least until prices reach the weekly swap level region 1.4850.
4hr view: The GBP/USD collapsed throughout the day on Friday, consuming several technical levels in the process. The only buying interest we saw that day was once price hit 4hr demand seen at 1.5106-1.5144, which occurred just before the market closed, meaning this could have simply been traders taking profits on their short positions for the day.
Considering the market’s overall position on the higher timeframes at the moment (see above), our team is naturally favoring short positions this week. However, selling into the current 4hr demand area is not something we’re comfortable with, no matter what the higher-timeframe structure is telling us. Therefore, for us to consider selling this pair, a convincing close will have to be seen not only below the current 4hr demand area, but also the round number lurking just below it at 1.5100 as well.
On the flip side, for anyone that’s considering buying from the current 4hr demand area, risk/reward parameters would argue against entering into a long position here. Sitting tight and waiting for price to close above the 4hr swap area at 1.5172-1.5211 would be a far more conservative approach, and one that we firmly support.
Our current buy/sell orders:
- Buy orders: Flat (Predicative stop-loss orders seen at: N/A).
- Sell orders: Flat (Predicative stop-loss orders seen at: N/A).
AUD/USD:
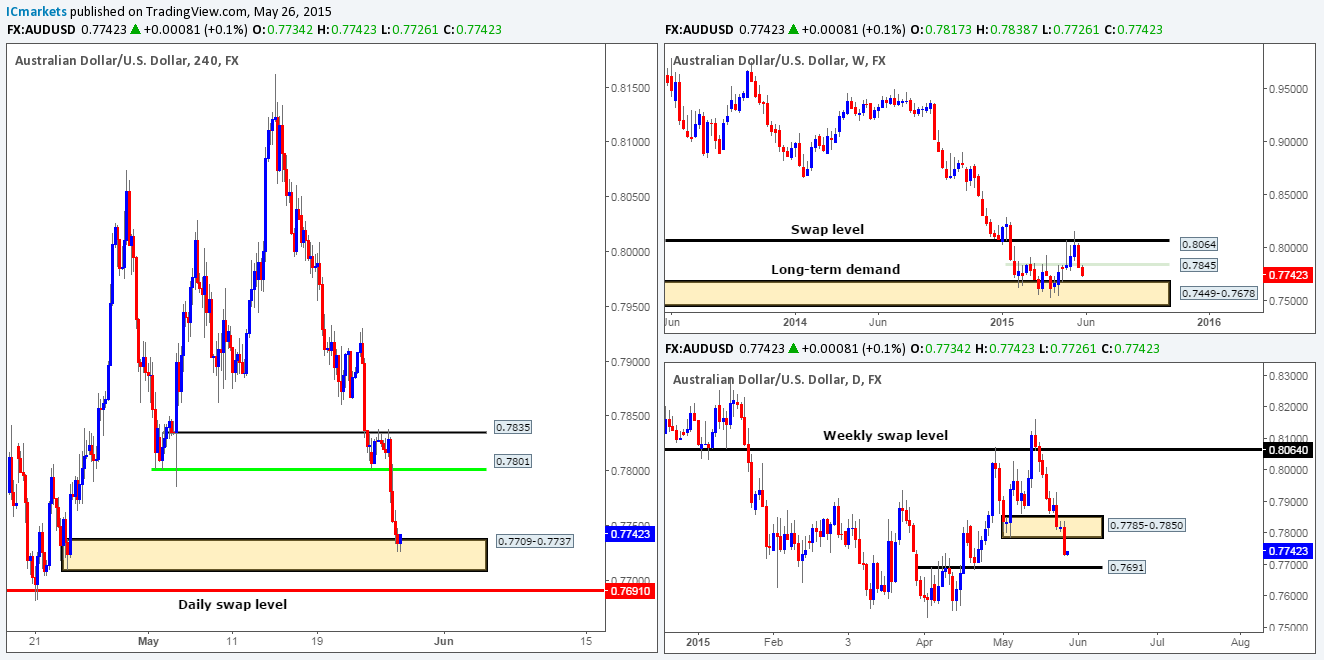
Weekly view: Last week’s action saw price sell off 240 pips from a long-term weekly swap level coming in at 0.8064. This momentum south printed a nice-looking weekly bearish pin-bar candle into the close 0.7839, which could imply further selling may take place this week back down to the weekly demand area seen at 0.7449-0.7678.
Daily view: The daily timeframe shows that Friday’s candle closed below a significant daily swap level seen at 0.7875, which in turn saw price attack a minor daily swap level located just below it at 0.7822. Buying from this level is a risky trade in our book. A more conservative approach would be to wait to see if price can close back above 0.7875, thus removing potential resistance and creating a more buyer-friendly zone.
4hr view: From this angle, we can see that the buyers valiantly attempted to get above the 0.7900 handle towards the end of Thursday’s sessions, but clearly failed. Consequent to this, we saw the market sell off on Friday, taking out a 4hr demand area at 0.7832-0.7862, and slam dunking itself into a 4hr demand area just below at 0.7790-0.7811 (located just below the daily swap level 0.7822). Buying the Aussie from here is not really something our team would be comfortable with especially with potential resistance looming just above at the recently broken 4hr demand area 0.7832-0.7862. Waiting for price to break above and retest this area would be the safer option in our opinion, as this would likely open up the doors to intraday buying towards at least 0.7900.
With regards to shorting this pair, our team has no interest in selling at this point in time unless a convincing close below the current 4hr demand base is seen. This would, as far as we can see, potentially do three things:
- Force a daily close below the daily swap level 0.7822, which on its own would likely imply further downside.
- Clear the path south down to 4hr demand at 0.7709-0.7735.
- Give traders the opportunity to trade any retest of the current 4hr demand zone.
Our current buy/sell orders:
- Buy orders: Flat (Predicative stop-loss orders seen at: N/A).
- Sell orders: Flat (Predicative stop-loss orders seen at: N/A).
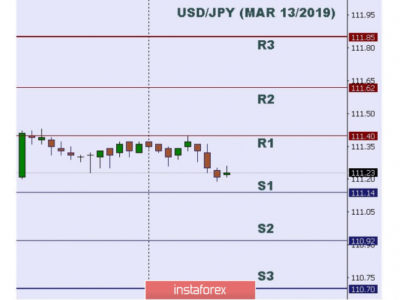
USD/JPY:
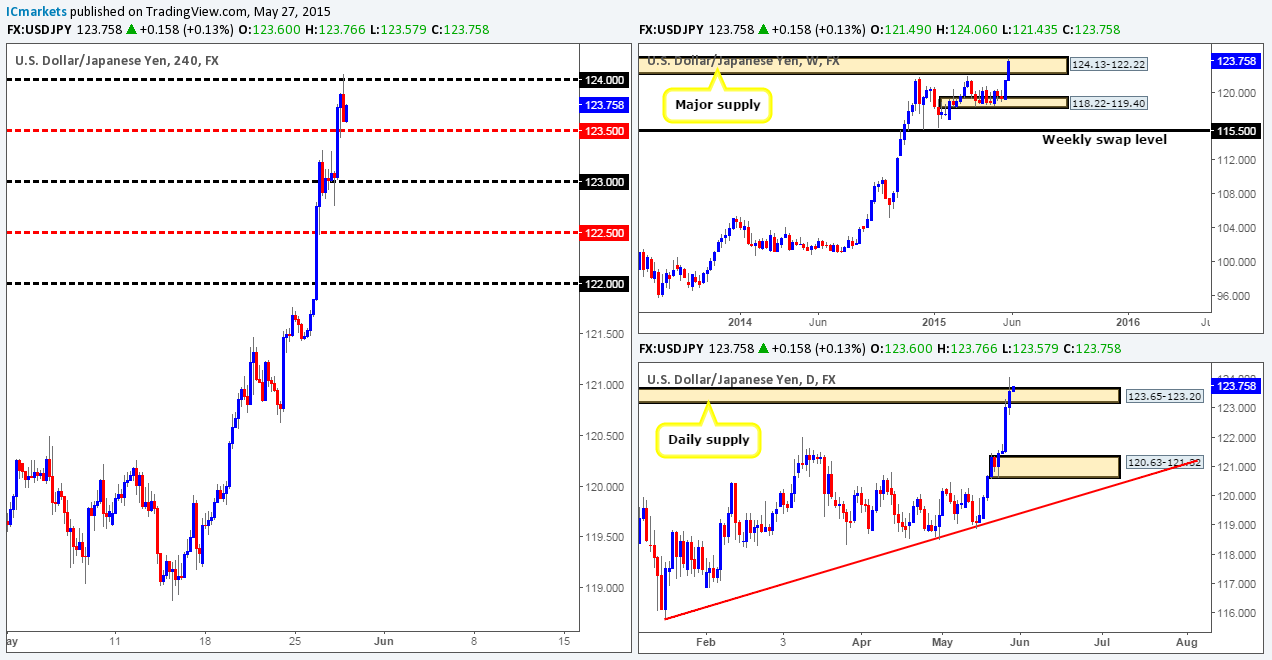
Weekly view: For the past month and a half, the buyers and sellers have been seen battling for position within a weekly demand area coming in at 118.22-119.40. Our long-term bias will remain north on this pair as long as price continues to trade above the weekly swap level seen below this area at 115.50.
Daily view: The rebound seen from the daily support level 118.62 extended higher during Friday’s session, consequently forcing the USD/JPY pair to close at 120.16 just below a daily Quasimodo resistance level coming in at 120.35. The move from here should not really come as much of a surprise. This daily support level boasted not only additional confluence from a daily trendline extended from the low 115.55, but also the fact that it is located deep within the aforementioned weekly demand area gave this move extra recognition.
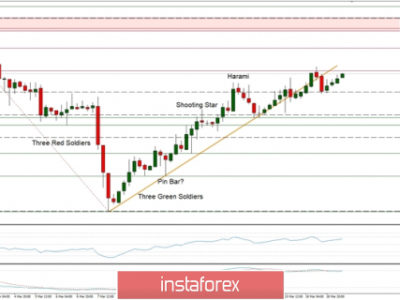
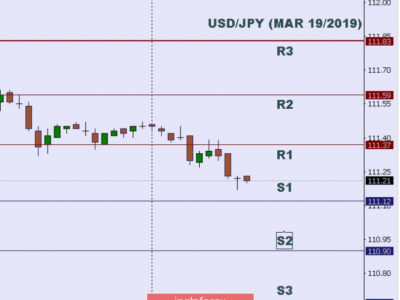
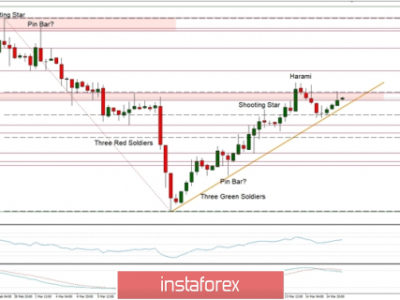
4hr view: The USD/JPY’s recent advance cleanly took out the 4hr supply area at 120.07-119.89, and also closed above a very important candle close -120.22. This close is extremely important to us since it likely suggests we’re going to see higher prices today and possibly into the week. At this point, you may be asking yourself why is 120.22 important? Well, take a look above 120.22, notice that strong selling wick seen marked with a black arrow at 120.42; this is very likely a supply consumption wick which means that above 120.22, prices would potentially be free of supply/resistance for a rally rally towards 120.73 – the 4hr Quasimodo resistance level.
So, with all of the above in mind, it all comes down to the recently broken 4hr supply area at 120.07-119.89 to hold as demand. In the event the buyers manage to defend this area, this would be a fantastic zone to look to buy from and target 120.73. However, what about the daily Quasimodo resistance level at 120.35? You would be right in thinking that by entering long at the 4hr swap area we would be buying into daily resistance! Nonetheless, our target is only 40 or so pips above this level which is a relatively small move on the daily scale. Moreover, let’s not forget that price is still trading from weekly demand at 118.22-119.40. Therefore, from where we’re standing, a buy trade at the 4hr swap area with supporting lower timeframe confirmation is worth the risk.
Our current buy/sell orders:
- Buy orders: 120.07-119.89 [Tentative – confirmation required] (Predicative stop-loss orders seen at: 119.86).
- Sell orders: Flat (Predicative stop-loss orders seen at: N/A).
USD/CAD:
Weekly view: Last week saw price aggressively spike below a weekly swap area coming in at 1.2265-1.2092 and snap back into the close 1.2156, thereupon forming a very sturdy-looking weekly bullish pin-bar candle in the process.
Daily view: From the daily timeframe, we can see that buying interest came into the market on Wednesday from deep within a daily demand area at 1.1931-1.2045, which, as you can probably see, also boasted additional support from a Harmonic bullish Bat pattern that completes just below at 1.1921. The buying from here continued until Friday’s close and managed to break above immediate daily supply at 1.2194-1.2102 by a pip. Granted, this is not a massive break by anyone’s standard, but a break it is. Therefore, we can only assume at this point that there may be weakness within this zone, and that further upside could be seen this week. Let’s see what we can find on the 4hr timeframe…
4hr view: The recent buying on this pair saw price break above the high 1.2194, and jab the round number 1.2200, which, as you can see, saw price rebound into the close.
With all of the above taken into consideration, we believe the following could take place this week…
- Support could form around the mid-level number 1.2150 and force price to attack 1.2200 once more, potentially providing us with a short entry into the market if selling confirmation is seen on the lower timeframes. A close above 1.2200 on the other hand, would, in effect, be our cue to begin watching for price to retest this level as support. Assuming a retest does take place and lower timeframe buying confirmation presented itself, we’d look to trail a long position all the way up to the 4hr supply area 1.2304-1.2277. Now, at this point you may be thinking why not target the 4hr supply area marked in green at 1.2267-1.2242? The reason for why is simply because we feel this is a ‘dummy supply zone’, which means pro money will see this area of supply and know there will be a ton of liquidity just above this zone in the form of buy stops – perfect to sell into, right?
The area we chose is seen just above, and is the more likely place where price will head to for the following reasons. 1. It’s located just within daily supply at 1.2326-1.2279, 2. It contains round number resistance 1.2300 and 3. It’s the most extreme area of supply from the 200-pip leg from 1.2086 to the high of our 4hr supply area – 1.2304. Pro money tends to aim for the best prices, which is usually at the most extreme area.
- Further selling could take place which could see price break below the mid-level number 1.2150, and attack the round number 1.2100. Assuming that the approach to 1.2100 is clean and fast, a potential buy trade may present itself here. However, just below this round number is a fresh 4hr demand zone coming in at 1.2056-1.2090, so be prepared for 1.2100 to be faked. Should price reach this zone in the manner described above, our team would then begin watching how price behaves on the lower timeframes, should a buy signal present itself, we’ll then look to enter long and take partial profits around 1.2150 with our stops placed below the 4hr demand at 1.2051.

Our current buy/sell orders:
- Buy orders: 1.2100/1.2056-1.2090 [Tentative – confirmation required] (Predicative stop-loss orders seen at: 1.2051).
- Sell orders: 1.2200 [Tentative – confirmation required] (Predicative stop-loss orders seen at: dependent on where one confirms this level).
USD/CHF:
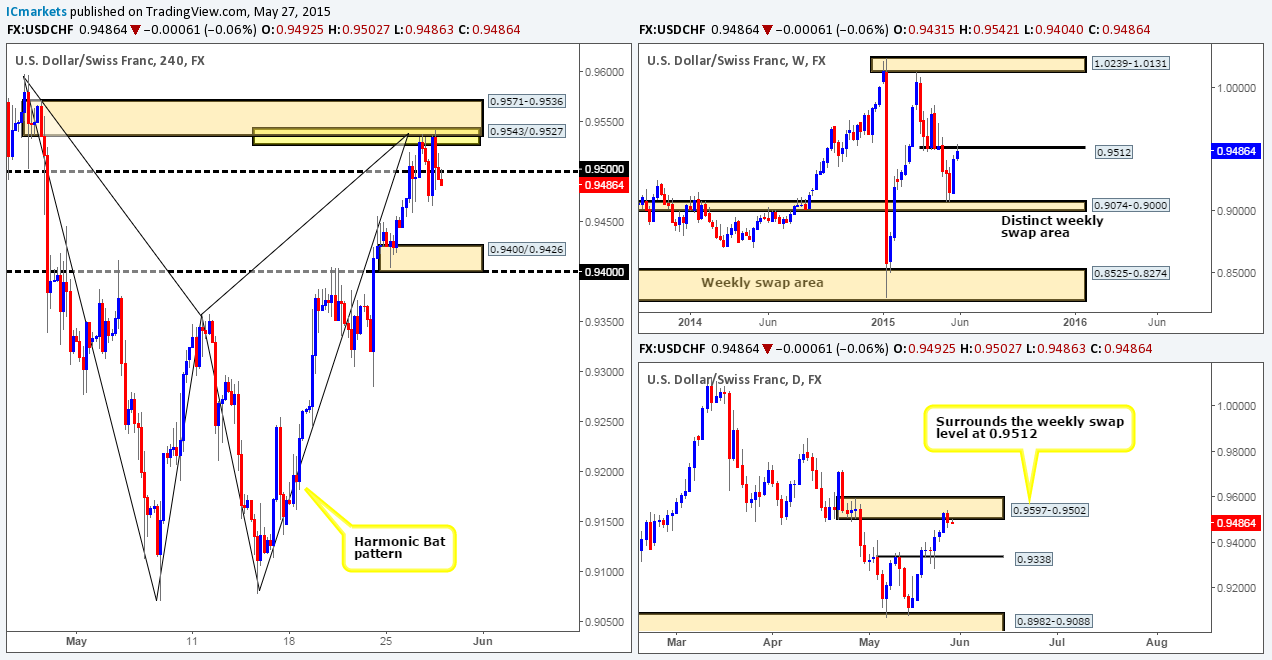
Weekly view: From the weekly scale, we can see that the sellers were the dominant force in the market last week. Weekly support at 0.9512 was taken out, which in turn saw price sell off down to a strong-looking weekly demand area at 0.9170-0.9343.
Daily view: Following the recent selling seen on this pair last week, price closed at 0.9324, consequently forming a daily indecision candle within a daily demand area coming in at 0.9267-0.9334 (located just within the aforementioned weekly demand area).
4hr view: During yesterday’s trading sessions, the round number 0.9300 was clearly supportive enough to turn things around and push price above the local swing high 0.9343.
Overall, from the weekly down to the 4hr timeframe this market remains in clear demand (see above). However, if buyers fail to hold above 0.9300 this week, then there’s a strong possibility prices will decline all the way down to the 0.9165 mark. Why that far? Well, take a look below the 0.9300 number to the left; can you see the clear demand consumption tails at: 0.9285/0.9267/0.9255/0.9228/0.9194? These tails suggest that demand has already been consumed, thus price could very easily drop down to the next active 4hr support level which is, as far as we can see, the 0.9165 level (positioned deep within the weekly demand area mentioned above at 0.9170-0.9343).
So, to sum up, 0.9300 is a key level to watch today. It will likely be the decider on where price heads to next. In the event a lower timeframe buy signal is seen around this region today, we’ll take a long position here and look to ride it up to 0.9400 area to take partial profits, knowing that we have the full backing of higher-timeframe support (see above) alongside us.
However, assuming that 0.9300 fails and price closes below this number, our team would then begin to watch how price behaves. Should we see a retest and price hold below this level, we would then consider entering short (with lower timeframe confirmation) for a potential drop down to 0.9165.
Our current buy/sell orders:
- Buy orders: Watching price action for lower timeframe buying confirmation around the 0.9300 region (Predicative stop-loss orders seen at: dependent on where one confirms this level).
- Sell orders: Flat (Predicative stop-loss orders seen at: N/A).
US 30:
Weekly view: Although the overall trend has been strong since early 2009, a temporary ‘ceiling’ to this index has formed around the 18098 region which has remained strong for an impressive four months!
Daily view: From the pits of the daily timeframe, we can see that selling interest came into the market on Thursday from a daily supply area at 18207-18117. As a result, this forced price to aggressively test and eventually rebound from a daily trendline support extended from the low 17033.
4hr view: (As mentioned in the previous analysis, the DOW has been forming what we believe to be a long-term 4hr bullish pennant formation – upper 4hr trendline extends from the 18279 high, while the lower 4hr line has been taken from the 17556 low).
The recent rally seen from the lower 4hr trendline resulted in prices closing at 18010, which is classed as mid-range to us. As such, trading anywhere in between these two converging trendlines at present is considered high-risk low-probability.
Until we see a definite higher timeframe move changing the 4hr pennant formation, either trendline extreme (see above in italics) could potentially provide trading opportunities this week. To be more specific, we’re going to focus more on the support and resistance levels that so beautifully converge with the two trendline extremes, 18110 and 17817. Alerts have been set at each level, once triggered; we’ll then begin watching for lower timeframe price action confirmation to enter a trade.

Our current buy/sell orders:
- Buy orders: 17817 [Tentative – confirmation required] (Predicative stop-loss orders seen at: dependent on where one confirms this area).
- Sell orders: 18110 [Tentative – confirmation required] (Predicative stop-loss orders seen at: dependent on where one confirms this area).
XAU/USD (Gold)
Weekly view: From a weekly timeframe perspective, the trend on Gold is still firmly south, and will remain that way in our opinion until price closes above the weekly trendline extended from the high 1488.0.With regards to last week’s action, however, we can see that despite the volatility seen from below weekly supply at 1223.1-1202.6, the end result barely saw any change in this market as price closed at 1177.93 – only 98 pips below last week’s close at 1177.91. In the event that further selling takes place this week, price could very well challenge the weekly demand area once again at 1130.1-1168.6.
Daily view: The daily timeframe on the other hand, shows that last week’s volatility eventually saw price break below daily demand at 1178.3-1185.8, and attack another daily demand area seen below it at 1159.4-1170.8 (located just within the weekly demand at 1130.1-1168.6).
4hr view: Friday’s sessions saw price aggressively sell off and slam into a small, yet clearly resilient 4hr demand area at 1168.6-1170.8 (located just within the daily demand area mentioned above at 1159.4-1170.8). The bounce seen from this 4hr area shows promise in our opinion, since there is really very little that we see stopping Gold from continuing to rally up to test the 4hr supply area at 1185.1-1182.2.
This 4hr supply area is key for us today, since this was likely the ‘decision-point’ if you will, where pro money initially ‘decided’ to push the market south. We have set an alert just below this zone, since we want to watch how price action behaves around this area. In the event that we see lower timeframe bearish strength entering the market here, we may look to take a short. It’s very difficult to pin-point a specific target at this point since the approach to the zone could form an area of demand.
On the flip side, should prices close ABOVE this 4hr supply zone, then we could potentially have a massive buying opportunity on our hands, let’s go through this step-by-step…
- A break above this 4hr supply area likely clears the path for buying up to around 4hr supply seen at 1207.3-1203.1.
- A move north is supported by daily timeframe demand at 1159.4-1170.8
- Notice that the 4hr supply just mentioned above is located just within weekly supply at 1223.1-1202.6. Therefore, even though we’re currently trading below weekly supply at present, there is effectively still room for a move north.
With regards to entry above this 4hr supply zone, we would not buy the breakout. Instead, we’d patiently wait to see if prices will retest this area of supply as demand, then begin looking for lower timeframe confirmation to enter long.

Our current buy/sell orders:
- Buy orders: Flat (Predicative stop-loss orders seen at: N/A).
- Sell orders: Watching for lower timeframe confirmation above 4hr demand 1185.1-1182.2 (Predicative stop-loss orders seen at: 1185.50).
The post Monday 4th April: Weekly technical outlook and review (UK and Japanese Bank holidays today) appeared first on .
Source:: Monday 4th April: Weekly technical outlook and review (UK and Japanese Bank holidays today)