
Previous Story
NZD/USD Intraday technical levels and trading recommendations for August 10, 2017
Posted On 10 Aug 2017
Comment: 0
Daily Outlook
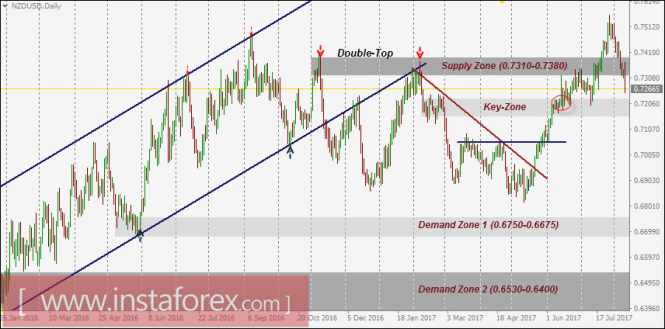
The NZD/USD pair has been trending up within the depicted bullish channel since January 2016.
In November 2016, early signs of bullish weakness were expressed on the chart when the pair failed to record a new high above 0.7400.
A bearish breakout of the lower limit of the channel took place in December 2016.
In February 2017, the depicted short-term downtrend was initiated in the depicted supply zone (0.7310-0.7380).
However, a recent bullish breakout above the downtrend line took place on May 22. Since then, the market has been bullish as depicted on the chart.
The price zone of 0.7150-0.7230 (Key-Zone) stood as a temporary resistance zone until a bullish breakout was expressed above 0.7230.
This resulted in a quick bullish advance towards the next supply zone around 0.7310-0.7380 which is temporarily breached to the upside.
A Recent bearish pullback is being executed towards the price zone of 0.7310-0.7380 (newly-established demand-zone) which failed to pause the ongoing bearish momentum.
Re-consolidation below the price level of 0.7300 brings the EUR/USD pair again towards 0.7230-0.7150 (Key-Zone) where price action should be watched for further decisions.
The material has been provided by InstaForex Company – www.instaforex.com
Source:: NZD/USD Intraday technical levels and trading recommendations for August 10, 2017


