
Previous Story
Technical analysis of GBP/USD for April 23, 2018
Posted On 23 Apr 2018
Comment: 0
Overview:
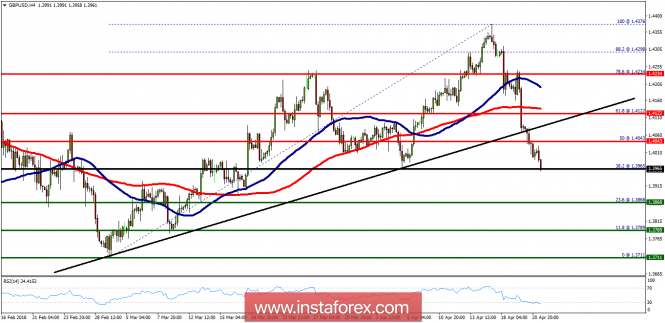
The GBP/USD pair continues to move downwards from the level of 1.4122. Last week, the pair dropped from the level of 1.4122 (this level of 1.4122 coincides with the major resistance) to the bottom around 1.3965. Today, the first resistance level is seen at 1.4043 followed by 1.4122, while daily support 1 is found at 1.3868. Also, the level of 1.3965 represents a weekly pivot point for that it is acting as major resistance/support this week. Amid the previous events, the pair is still in a downtrend, because the GBP/USD pair is trading in a bearish trend from the new resistance line of 1.4043 towards the first support level at 1.3868 in order to test it. If the pair succeeds to pass through the level of 1.3868, the market will indicate a bearish opportunity below the level of 1.3789 in coming days. On the other hand, if a breakout happens at the resistance level of 1.4122, then this scenario may be invalidated.
The material has been provided by InstaForex Company – www.instaforex.com


