
Previous Story
Technical analysis of NZD/USD for January 29, 2018
Posted On 29 Jan 2018
Comment: 0
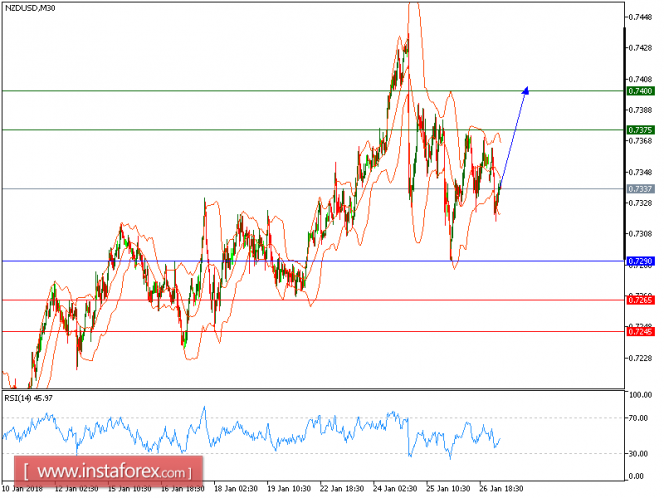
NZD/USD is expected to trade with bullish bias above 0.7290. The pair remains in an uptrend and is now trading above its 20-period and 50-period moving averages. A strong support base at 0.7290 has formed and has allowed for a temporary stabilization. Last but not least, the relative strength index is bullish above its neutrality area at 50.
In which case, as long as 0.7290 is not broken, likely advance to 0.7375 and 0.7400 in extension.
The black line shows the pivot point. Currently, the price is above the pivot point, which is a signal for long positions. If it remains below the pivot point, it will indicate short positions. The red lines are showing the support levels, while the green line is indicating the resistance levels. These levels can be used to enter and exit trades.
Resistance levels: 0.7375, 0.7400, and 0.7450.
Support levels: 0.7265, 0.7245, and 0.7240.
The material has been provided by InstaForex Company – www.instaforex.com


