
Previous Story
Technical analysis of NZD/USD for January 5, 2018
Posted On 05 Jan 2018
Comment: 0
Overview:
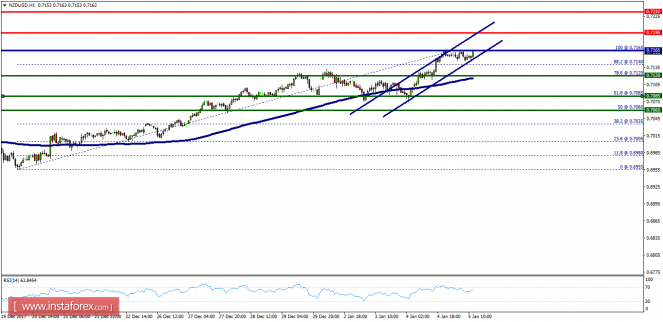
- The NZD/USD pair is continuing to rise from the level of 0.7120 in the long term. It should be noted that the support is established at the level of 0.7120 which represents the 78.6% Fibonacci retracement level on the H1 chart. The price is likely to form a double bottom in the same time frame. Accordingly, the NZD/USD pair is showing signs of strength following a breakout of the highest level of 0.7165. So, buy above the level of 0.7165 with the first target at 0.7195 in order to test the daily resistance 1 and further to 0.7232. Also, it might be noted that the level of 0.7232 is a good place to take profit because it will form a double top. However, in case a reversal takes place and the NZD/USD pair breaks through the support level of 0.7120, a further decline to 0.7060 can occur which would indicate a bearish market.
The material has been provided by InstaForex Company – www.instaforex.com


