
Previous Story
Technical analysis of NZD/USD for July 11, 2017
Posted On 11 Jul 2017
Comment: 0
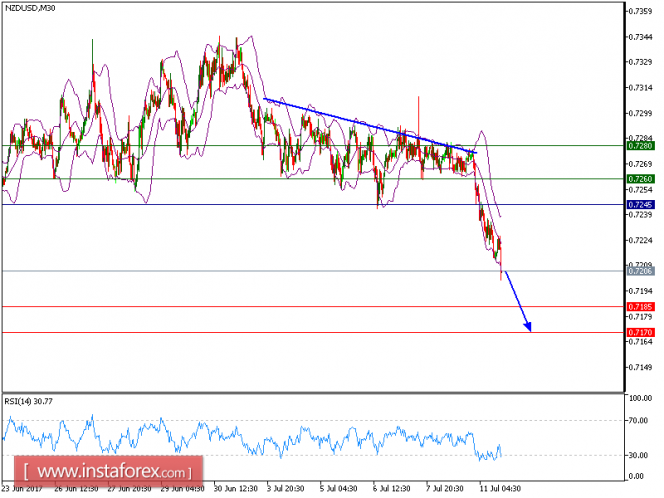
Our both targets which we predicted in yesterday’s analysis have been hit precisely as expected. NZD/USD is still trading downward and is likely to continue its movement. The pair broke below the lower boundary of Bollinger Bands, which indicated the continuation of bearish trend. The relative strength index is heading downward.
Hence, as long as 0.7245 holds on the upside, look for a further decline to 0.7185 and even to 0.7170 in extension.
Strategy: SELL Stop Loss: 0.7245 Take Profit: 0.7185
Chart Explanation: The black line shows the pivot point. Currently, the price is above the pivot point which indicates the bullish position. If it is below the pivot points, it indicates the short position. The red lines show the support levels and the green line indicates the resistance levels. These levels can be used to enter and exit trades.
Resistance levels: 0.7260, 0.7280, and 0.7305
Support levels: 0.7185, 0.7170, and 0.7145
The material has been provided by InstaForex Company – www.instaforex.com


