
Previous Story
Technical analysis of NZD/USD for July 31, 2017
Posted On 31 Jul 2017
Comment: 0
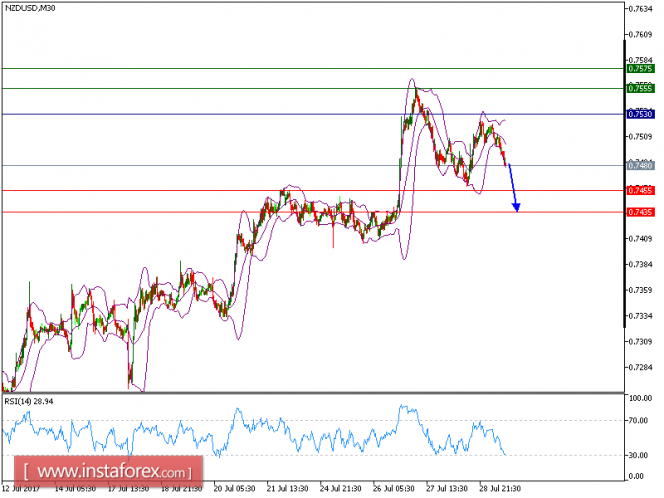
NZD/USD is expected to trade with bearish outlook. The pair broke below its 20-period and 50-period moving averages, while the relative strength index is below it neutrality level at 50 and lacks upward momentum. Nevertheless, 0.7530 is playing a key resistance role, which should limit the upside potential.
As long as this key level is not broken, look for a technical slide towards 0.7455 and even 0.7435 in extension.
Strategy: SELL Stop Loss: 0.7530 Take Profit: 0.7455
Chart Explanation:
The black line shows the pivot point. Currently, the price is above the pivot point which indicates the bullish position. If it remains below the pivot point, it will indicate the short position. The red lines show the support levels and the green line indicates the resistance levels. These levels can be used to enter and exit trades.
Resistance levels: 0.7555, 0.7575, and 0.7610
Support levels: 0.7555, 0.7575, and 0.7525
The material has been provided by InstaForex Company – www.instaforex.com


