
Previous Story
Technical analysis of NZD/USD for September 06, 2017
Posted On 06 Sep 2017
Comment: 0
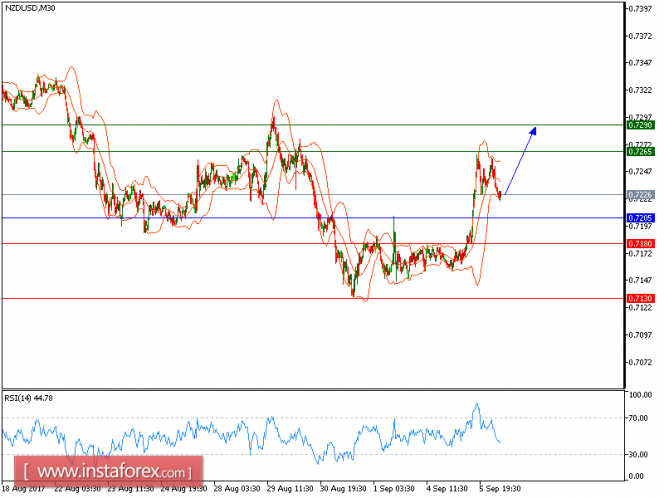
All our targets which we predicted in our previous analysis has been hit. NZD/USD still expected to trade in a higher range and continue the rebound from 0.7130. The pair broke above the upper boundary of the triangle pattern, which confirmed the continuation of a bullish trend. The upward momentum is further reinforced by the rising 20-period and 50-period moving averages. The relative strength index is bullish and calls for another upside.
To sum up, as long as 0.7205 is not broken, look for a new challenge to 0.7265 and even to 0.7290 in extension.
The black line shows the pivot point. Currently, the price is above the pivot point, which indicates the bullish position. If it remains below the pivot point, it will indicate the short position. The red lines show the support levels and the green line indicates the resistance levels. These levels can be used to enter and exit trades.
Resistance levels: 0.7265, 0.7290, and 0.7325
Support levels: 0.7180, 0.7130, and 0.7085
The material has been provided by InstaForex Company – www.instaforex.com
Source:: Technical analysis of NZD/USD for September 06, 2017


