
Previous Story
Technical analysis of USD/CHF for November 27, 2017
Posted On 27 Nov 2017
Comment: 0
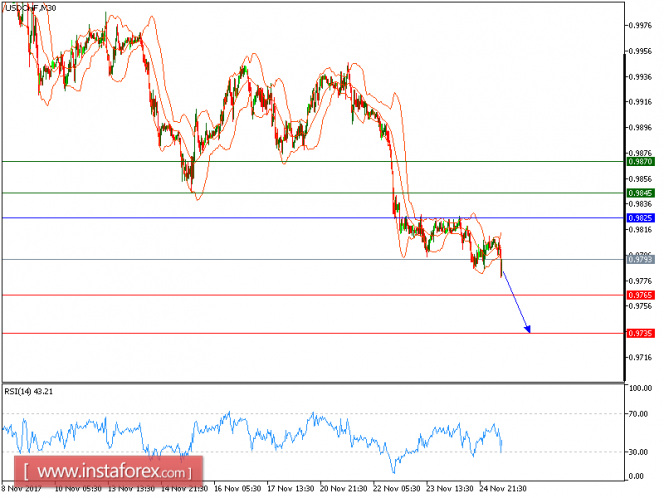
Our first targets which we predicted in the previous analysis has been hit. The pair remains under pressure below the key resistance at 0.9825, which should limit any upward attempts. Both the 20-period and 50-period moving averages are turning down, and should continue to push the prices lower. Last but not least, the relative strength index lacks upward momentum.
In which case, as long as 0.9825 is not surpassed, likely decline to 0.9765 and 0.9735 in extension.
Chart Explanation: The black line shows the pivot point. The present price above the pivot point indicates a bullish position, and the price below the pivot points indicates a short position. The red lines show the support levels and the green line indicates the resistance levels. These levels can be used to enter and exit trades.
Strategy: SELL, Stop Loss: 0.9825, Take Profit: 0.9765
Resistance levels: 0.9845, 0.9870, and 0.9900
Support levels: 0.9765, 0.9735, and 0.9700
The material has been provided by InstaForex Company – www.instaforex.com
Source:: Technical analysis of USD/CHF for November 27, 2017


