
Previous Story
Technical analysis of USD/CHF for September 06, 2017
Posted On 06 Sep 2017
Comment: 0
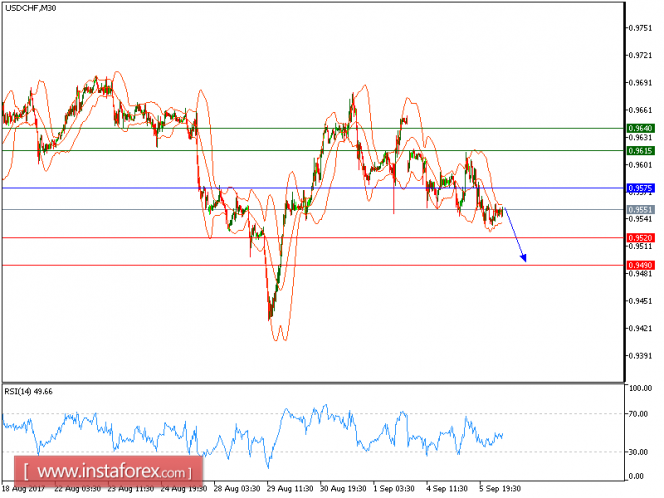
The target which we have given in our previous signal has been hit. USD/CHF is expected to trade with a bearish outlook. The pair is trading below its declining 20-period and 50-period moving averages, which play resistance roles and maintain the downside bias. The relative strength index is bearish below its neutrality level at 50.
The U.S. Commerce Department reported that factory orders decreased 3.3% on month in July (as expected, vs. +3.2% in June), while durable goods orders fell 6.8% on the month (vs. -2.9% expected, +6.4% in June).
Hence, as long as 0.9575 holds on the upside, a further decline to 0.9520 and even to 0.9490 seems more likely to occur.
Chart Explanation: The black line shows the pivot point. The present price above the pivot point indicates the bullish position, and the price below the pivot points indicates the short position. The red lines show the support levels and the green line indicates the resistance levels. These levels can be used to enter and exit trades.
Strategy: SELL, Stop Loss: 0.9575, Take Profit: 0.9520
Resistance levels: 0.9640, 0.9670, and 0.9715
Support levels: 0.9545, 0.9500, and 0.9475
The material has been provided by InstaForex Company – www.instaforex.com
Source:: Technical analysis of USD/CHF for September 06, 2017


