
Previous Story
Technical analysis of USD/JPY for June 29, 2017
Posted On 29 Jun 2017
Comment: 0
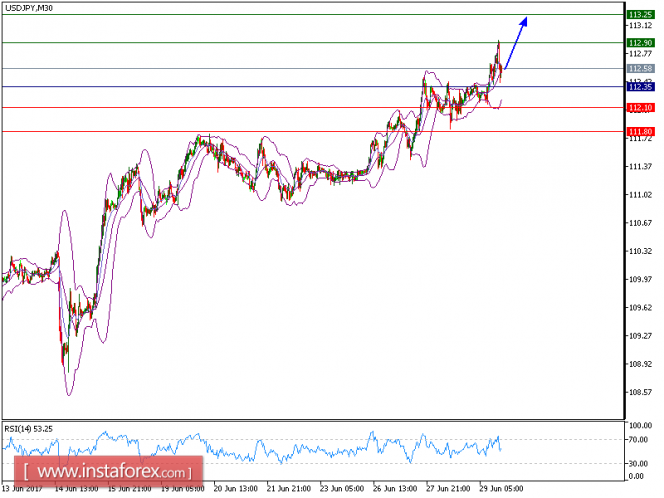
All our targets which we predicted in yesterday’s analysis have been hit. The pair is expected to continue its upside move as it is trading above the rising 20-period and 50-period moving averages, which play support roles and maintain the upside bias. The relative strength index is bullish and calls for a further advance.
Therefore, as long as 112.35 holds on the downside, look for a new rise to 112.90 and even to 113.25 in extension.
Alternatively, if the price moves in the opposite direction as predicted, short position is recommended below 112.35 with targets at 112.10 and 111.80.
Chart Explanation: The black line shows the pivot point. The present price above pivot point indicates the bullish position while the price below pivot point indicates the short position. The red lines show the support levels and the green line indicates the resistance levels. These levels can be used to enter and exit trades.
Strategy : BUY, Stop Loss: 112.35, Take Profit: 112.90
Resistance levels: 112.90, 113.25, and 113.75
Support levels: 112.10,111.80, and 111.30
The material has been provided by InstaForex Company – www.instaforex.com


