
Previous Story
Technical analysis of USDX for February 21, 2017
Posted On 21 Feb 2017
Comment: 0
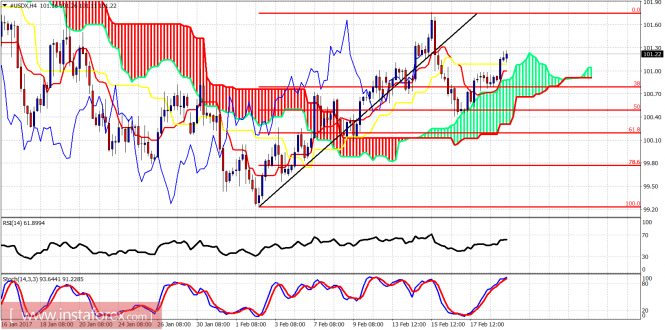
The Dollar index is making higher highs and higher lows in the short term. As explained in the previous analysis there are a lot of chances that the low at 99.25 was a cycle low and a new uptrend has started. Key for this bullish scenario is the level of 99.25.
The Dollar index bounced off the 50% retracement. Resistance is the recent high at 101.80 area. Breaking above it will be a bullish sign and will decrease the chances of success of the bearish Head and Shoulders pattern explained in previous posts.
Black line – neckline support
Green line – trendline support
As explained in the previous posts the low at 99.25 is very possible an important long-term low as the wave 4 could already be complete and the next legup can already have started. Resistance is at 101.70 at the tenkan-sen (red line indicator). Last week the prices got rejected there. We could still be forming the right hand shoulder, but the bears will soon need to break below 100.35 in order for this scenario to still be valid.
The material has been provided by InstaForex Company – www.instaforex.com


