
Previous Story
Thursday 13th November: Daily technical outlook and review.
Posted On 13 Nov 2014
Comment: 0
EUR/USD:
Weekly Timeframe: The weekly timeframe shows that a small reaction is currently being seen off of a combined weekly demand/Quasimodo support area at 1.22403-1.24420/1.22866. In the event that further buying ensues from here, there is a good chance that price will hit the weekly support flip level coming in at 1.27541.
Daily Timeframe: Thanks to the daily timeframe, we know that for the time being going long may not be the best path to take, as price is currently ranging between a small daily supply area at 1.25763-1.24794, and a long-term daily demand area seen at 1.22877-1.23809. It is only once one of these areas is consumed, will we then have some idea on where price is likely to trade to next.
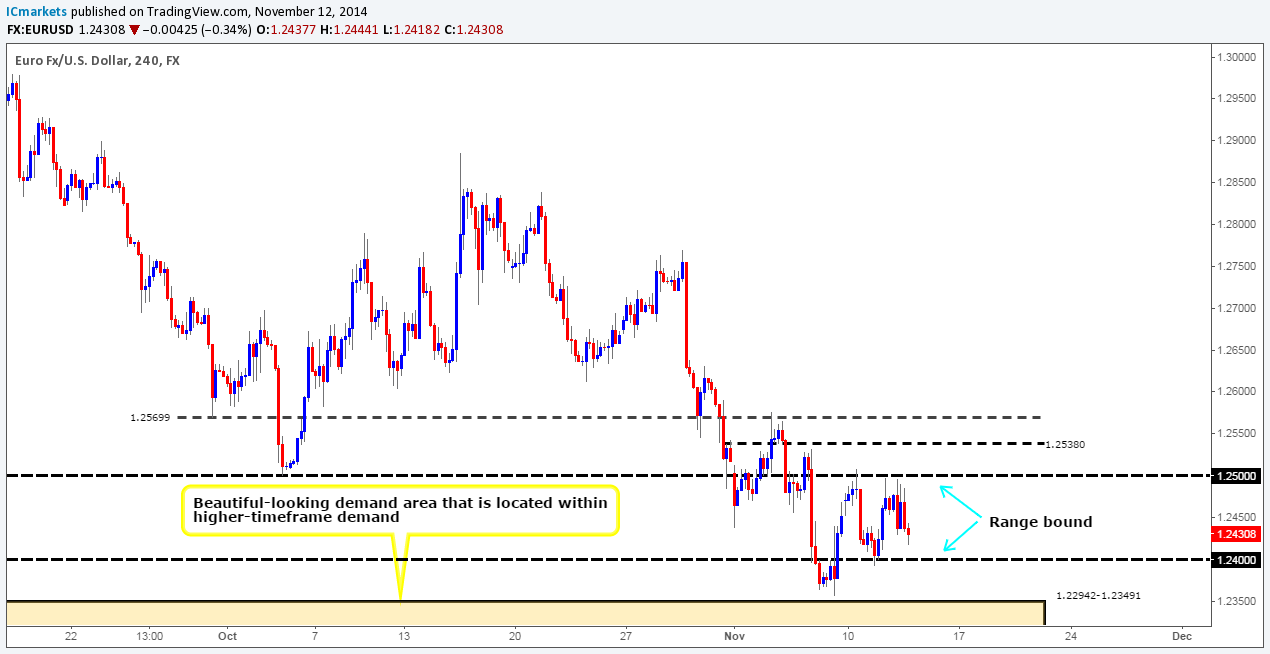
4hr Timeframe: The EUR/USD on the 4hr timeframe continues to swing between 1.25 and 1.24. Trading the limits of this range is definitely a valid strategy. However, when range trading we would almost always require lower-timeframe confirmation. Some traders may wait for a pin-bar formation, others a cross of an EMA, we nonetheless prefer to usually wait for an opposing supply or demand area to be consumed, this way we know with a high probability that price has reversed and is at least likely going to trade to the next decision-point on that timeframe.
If one is considering trading the current 4hr range, potential buy orders are seen at 1.24057, and likewise sell orders at 1.24977. Selling here will require very strict trade management, since we mustn’t forget that price is trading around a monster combined weekly demand/Quasimodo support area (1.22403-1.24420/1.22866) at the moment. A breakout of this range is what we’re personally waiting for. A push north would likely attract further buying up towards 1.25380 (tentative sell orders are seen just below at 1.25347), and in the same way, a break south would likely encourage follow-through selling down towards a 4hr demand seen at 1.22942-1.23491 (active buy orders are seen just above at 1.23557).
Buy/sell levels:
- Buy orders: 1.24057 [Tentative] (Predicative stop-loss orders seen at: 1.23749) 1.23557 [Tentative] (Predicative stop-loss orders seen at: 1.22894).
- Sell orders: 1.24977 [Tentative] (Predicative stop-loss orders seen at: 1.25132) 1.25347 [Tentative] (Predicative stop-loss orders seen at: 1.25837).
GBP/USD:
Weekly Timeframe: Serious selling interest is currently being shown on the weekly timeframe at the moment. Assuming the sellers continue to dominate, we see very little on this timeframe stopping them from pushing prices down towards an obvious weekly resistance flip level coming in at 1.57166.
Daily Timeframe: The daily timeframe on the other hand is showing that price must consume a daily demand area seen at 1.57736-1.58390 before being able to hit the aforementioned weekly resistance flip level. Let’s see if the 4hr timeframe offers us anything.
4hr Timeframe: The 4hr timeframe shows that aggressive sellers came into the market at around 1.59394, which consequently consumed both the round-number level 1.59, and a small 4hr demand area coming in at 1.58338-1.58573.
At the time of writing price is currently trading deep within a combined 4hr demand/round-number area at 1.57736-1.58110/1.58 (located deep within the aforementioned daily demand area). Very little buying interest is being seen here, and as we can all see 1.58 has also just been consumed providing extra resistance to the market. That being the case, we feel that further selling of the British pound will be seen today down towards a fresh 4hr demand area coming in at 1.57187-1.57439. This area of demand is located a few pips above the aforementioned weekly resistance flip level, so we have to be prepared for a fakeout below this area before any rally higher in price is seen. We intend to set a pending buy order at 1.57484, with a stop loss placed below the next decision-point on this timeframe at 1.56938 in an attempt to avoid any potential fakeout.
Buy/sell levels:
- Buy orders: 1.57484 (Predicative stop-loss orders seen at: 1.56938).
- Sell orders: N/A (Predicative stop-loss orders seen at: N/A).
AUD/USD:
Weekly Timeframe: Buying interest is currently being seen on the weekly timeframe. This comes after price had closed below a major weekly demand area at 0.86591-0.88247 last week. If follow-through buying is seen from here, prices could potentially test 0.88874, a weekly support flip level. Let’s see what we can find on the lower timeframes.
Daily Timeframe: The rebound from the daily resistance flip level at 0.85504 extended higher recently, resulting in price trading deep within a daily decision-point supply area coming in at 0.87608-0.86798. For us to be convinced that higher prices will likely follow, this important area of supply will need to be consumed. The reason for its importance is simply because within this area, we believe that this is where pro money likely made the ‘decision’ to break below the major weekly demand area mentioned above.
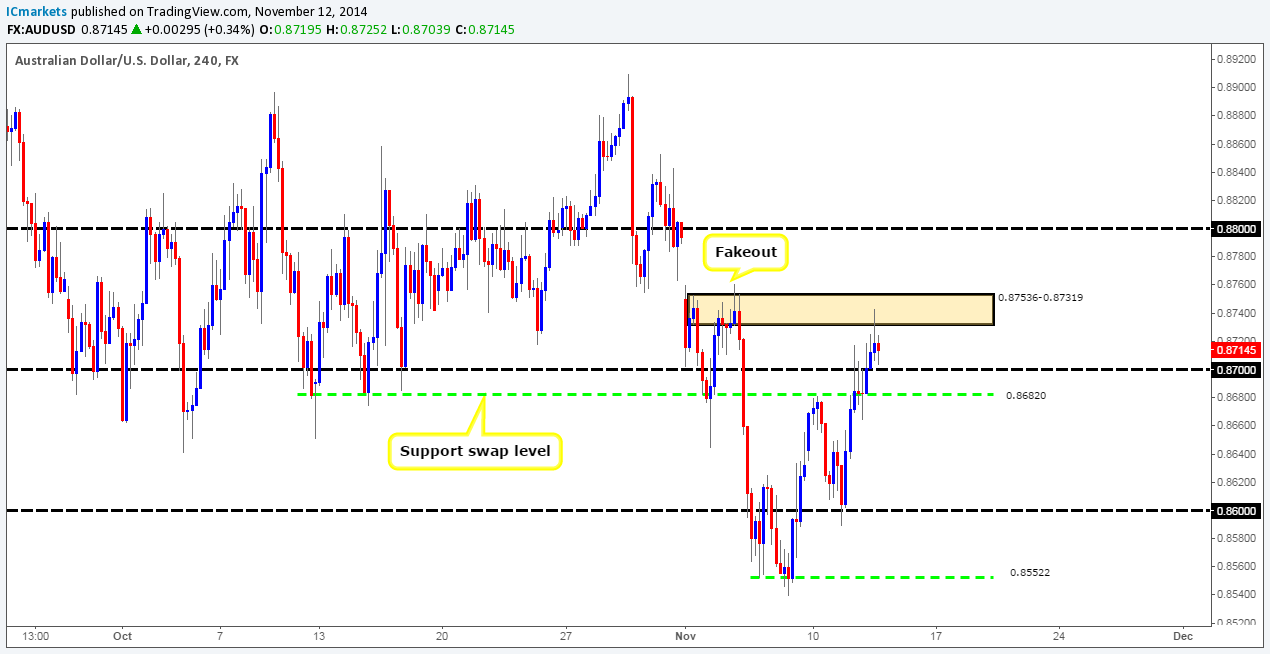
4hr Timeframe: It was mentioned in the previous analysis that we intended to focus on selling opportunities until the aforementioned daily decision-point supply area is consumed, which still remains to be the case. We also reported that we thought price would see a small rally up towards a 4hr supply zone coming in at 0.87536-0.87319, which as we can all see did happen – sell orders have already been filled around 0.87298.
For anyone who is currently short the Aussie with us, we are currently watching for 0.87 to be consumed, as this will likely clear the path south down to at least a small 4hr support swap level seen at 0.86820, which is our first take-profit target. So for the time being we are forced to sit on our hands and see how price action unfolds, with a little effort from the sellers, we can hopefully secure our trade with a little profit later today.
Buy/sell levels:
- Buy orders: N/A (Predicative stop-loss orders seen at: N/A).
- Sell orders: 0.87298 – LIVE (Predicative stop-loss orders seen at: 0.87653).
USD/JPY:
Weekly Timeframe: The weekly timeframe shows that the USD/JPY continues to rally after price broke above a major weekly supply area last week seen at 114.650-112.530. We feel that there is a good chance this rally will continue until price hits a weekly supply area coming in at 117.931-116.799. It will be interesting to see what the lower timeframes show.
Daily Timeframe: The daily timeframe shows that the daily Quasimodo resistance area seen at 115.911-115.021 has seen a small break above. This is not a good sign for anyone short this pair at the moment, as it has potentially cleared the path north towards 117.120, a daily Quasimodo resistance level. A small correction could well be seen from here since there have likely been a lot of buy stops taken out above this area, which pro money may capitalize on for short-term gain. Ultimately though, we are expecting prices to rally once more up to the aforementioned daily Quasimodo resistance level. The 4hr timeframe will likely give us some idea as to where price could reverse to before rallying higher.
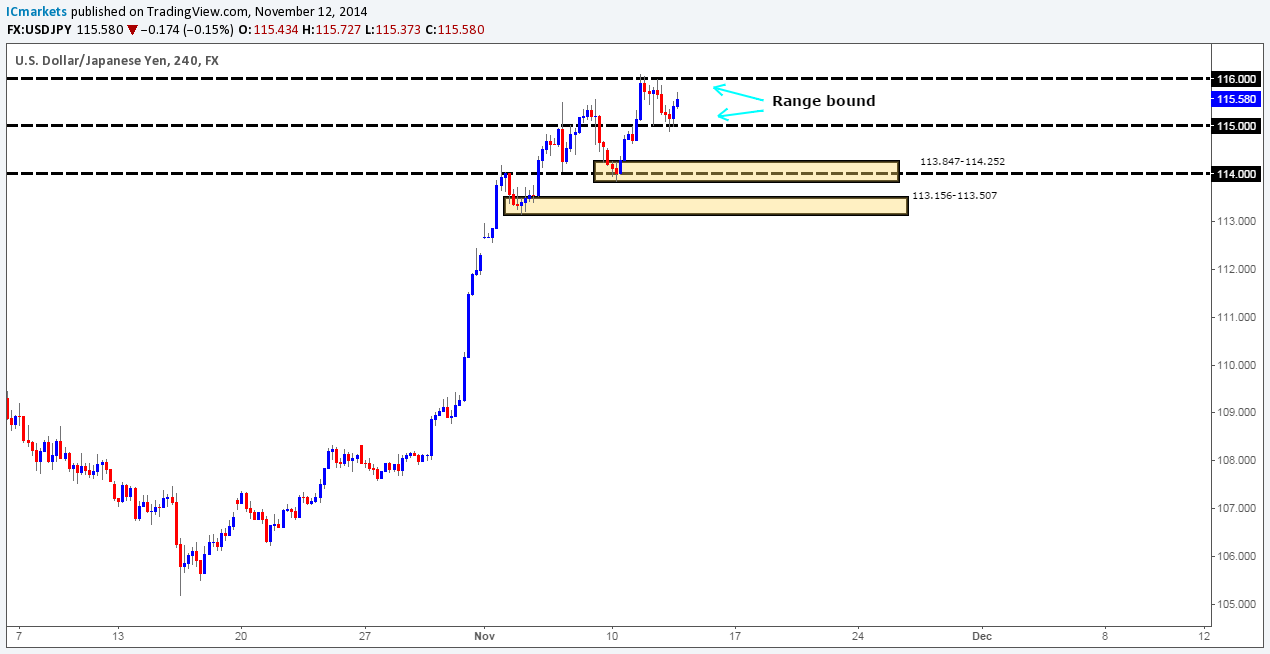
4hr Timeframe: At this point in time, price has reversed no lower than 115, which as a result has caused price to temporarily range between here and 116. As far as buying is concerned, we are a little cautious, since price could just as easily break below 115, and trade down towards a nice-looking combined 4hr demand/round-number area at 113.847-114.252/114, where potential buy orders are likely lurking just above at 114.340. However, in our opinion, for higher prices to be confirmed, a positive 4hr close above 116 would need to be seen. Following this, we would become very interested in joining this trend on a positive retest of 116 as support up to at least 117.120, the aforementioned daily Quasimodo resistance level.
Buy/sell levels:
- Buy orders: 114.340 (Predicative stop-loss orders seen at: 113.734).
- Sell orders: N/A (Predicative stop-loss orders seen at: N/A).
EUR/GBP:
Weekly Timeframe: Price remains trading around a weekly demand area seen at 0.76931-0.78623 – a great area to be looking for buying opportunities. Nevertheless, considering where price is currently located, we have not seen much in the way of buying strength over the past two months. Let’s see what we can find on the lower timeframes.
Daily Timeframe: The daily timeframe shows price continues to range between a minor daily supply area at 0.79109-0.78609 and a temporary daily support coming in at 0.78132. Ultimately, we would like to see prices close above the daily supply area, as this would likely confirm buying strength from the aforementioned weekly demand area.
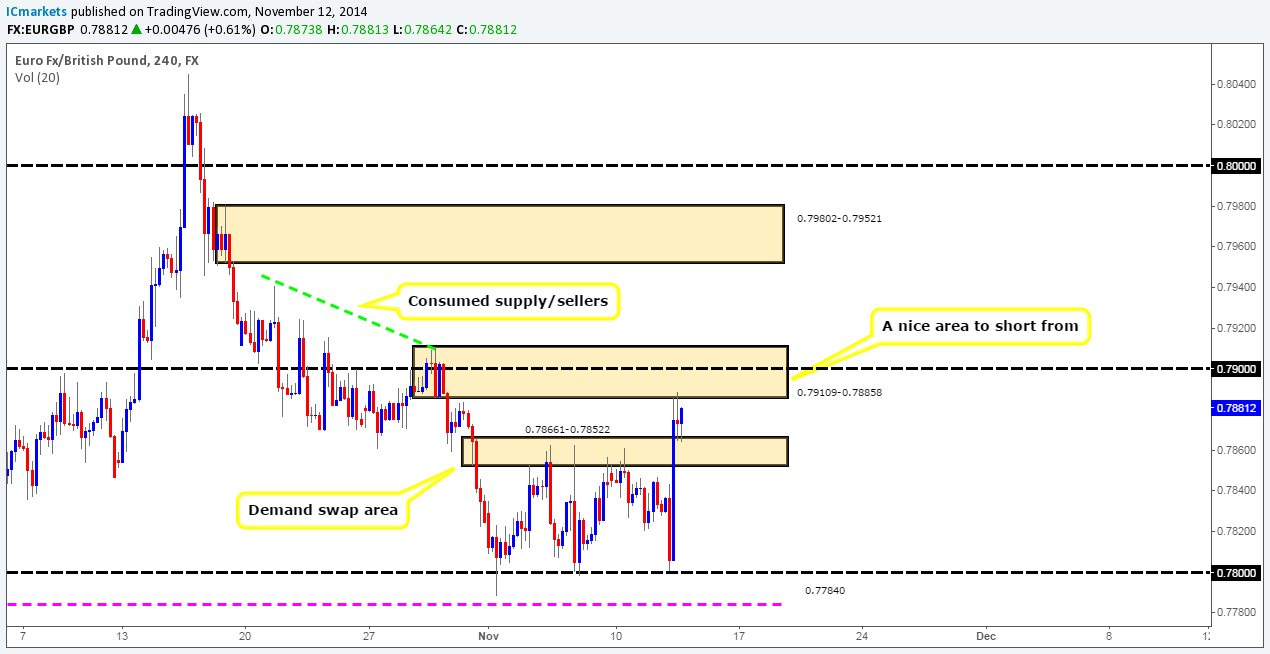
4hr Timeframe: As we can all see, a breakout above the 4hr decision-point supply area at 0.78661-0.78522 did indeed happen, which resulted in further buying consequently pushing prices up to a combined 4hr supply/round-number area seen at 0.79109-0.78858/0.79 (located deep within the aforementioned daily supply area). It was mentioned that if any short trades were taken around here, aggressive trade management would be required, since we would be effectively selling into higher timeframe demand (see the weekly analysis above).
At this point in time, for us to be convinced lower prices are going to be seen, we would need to see the 4hr demand swap area at 0.78661-0.78522 consumed, which as of now does not seem likely. If price decides to break above the combined 4hr supply/round-number area, we feel that there is a good chance higher prices will be seen up to a 4hr supply area coming in at 0.79802-0.79521, since most the supply/selling opposition has already likely been consumed to the left marked with a green trend line.
Buy/sell levels:
- Buy orders: N/A (Predicative stop-loss orders seen at: N/A).
- Sell orders: N/A (Predicative stop-loss orders seen at: N/A).
USD/CAD:
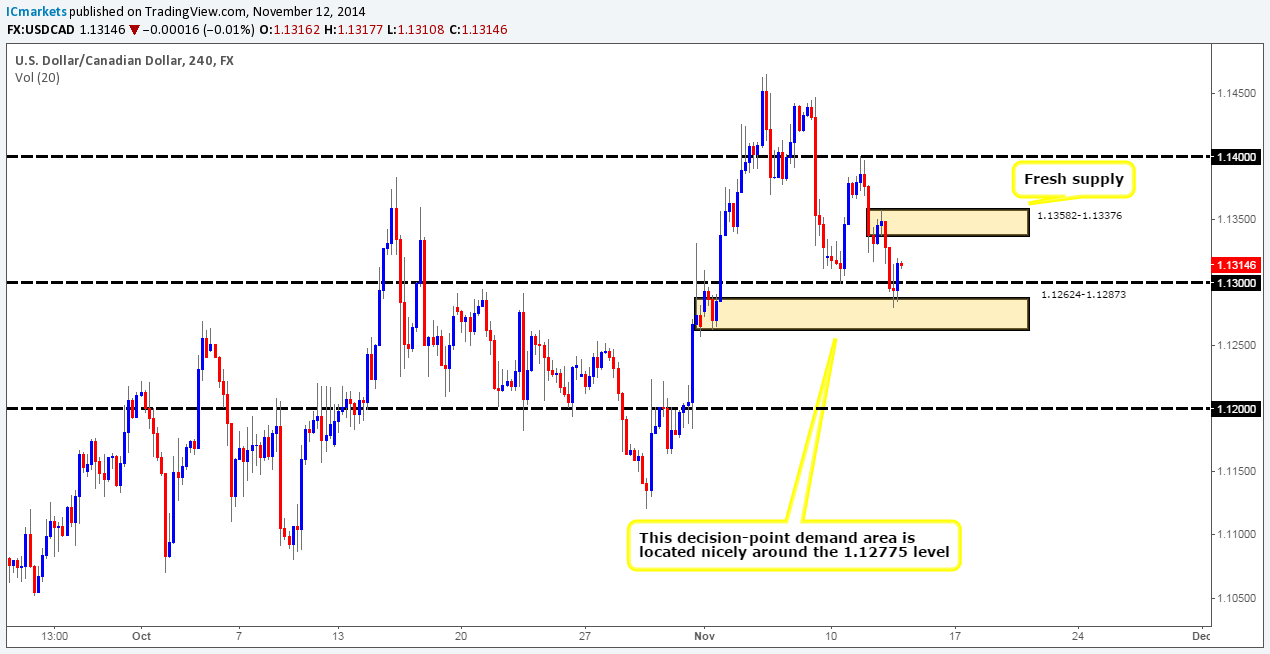
Weekly Timeframe: The weekly timeframe shows that price seems to have retested the medium-term weekly high 1.12775 as support. It will be interesting to see what the lower-timeframe price action looks like, as this level could provide a nice base to buy into this market targeting the weekly supply area seen above at 1.17225-1.15417.
Daily Timeframe: The daily timeframe clearly shows that there is some buying interest currently being seen off of the 1.12775 level. Nevertheless, it is very difficult to ascertain whether this buying is legit, as it could just be short covering in motion. Let’s take a look on the 4hr timeframe to see what we can find.
4hr Timeframe: The 4hr timeframe shows that our buy order set just above the 4hr decision-point demand area (1.12624-1.12873) at 1.12916 has been filled. The first take-profit target we have our eye on is just below the 4hr supply area (1.13582-1.13376) at 1.13357.
We are very confident that higher prices are going to be seen from here, the reason for this, apart from being in an excellent higher-timeframe position, is how price reacted off of the 4hr demand area. Notice that the initial reaction printed an indecision candle where the high likely consumed any sellers around 1.13168, a small 4hr support flip level. Therefore, there is likely very little selling opposition until price hits the aforementioned 4hr supply area above.
Buy/sell levels:
- Buy orders: 1.12916 – LIVE (Predicative stop-loss orders seen at: 1.12534).
- Sell orders: N/A (Predicative stop-loss orders seen at: N/A).
USD/CHF:
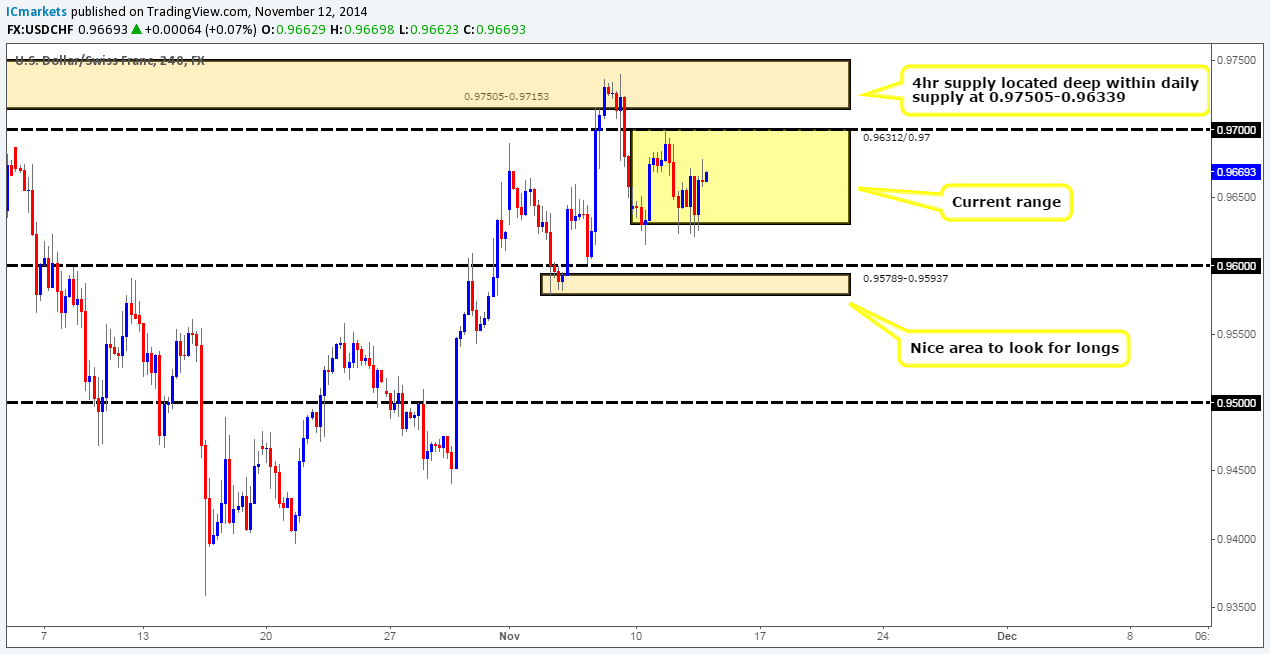
Weekly Timeframe: The weekly timeframe still shows price is capped between a weekly supply area coming in at 0.98378-0.95895, and a weekly resistance flip level seen at 0.94546.That being said though, most of the current trading action is taking place within the weekly supply area at the moment, so any buy trades initiated will require strict trade management rules.
Daily Timeframe: Current trading action on the daily timeframe reveals that price is trading within a major daily supply area coming in at 0.97505-0.96339 (located within the aforementioned weekly supply area). That being said though, considering where price is located there is very little selling pressure being seen at the moment. In the event that the sellers do become active here, it is very likely price will hit a daily decision-point demand level seen at 0.95965. On the other hand, a breakout above the daily supply area would likely mean prices are potentially going to challenge the extremes of the aforementioned weekly supply area. Let’s see what the 4hr timeframe can offer us.
4hr Timeframe: The 4hr timeframe reveals that price is currently consolidating between 0.96312 and 0.97. Opportunities to trade this range are likely there with tentative buy orders seen at 0.96333, and sell orders are seen at 0.96977). With that being said, we would not feel comfortable trading these levels with immediate pending orders, lower-timeframe confirmation would be required, since range formations such as this are prone to fakeouts which can lead to unnecessary losses.
If price were to breakout north here, this would likely attract further buying up to at least the 4hr supply area coming in at 0.97505-0.97153, where at which point we would be interested in selling the U.S Dollar around 0.97123 (located relatively deep within both aforementioned higher-timeframe supply areas – weekly supply: 0.98378-0.95895, daily supply: 0.97505-0.96339). On the other hand, assuming the sellers took it upon themselves to sell into this market breaking below the current range; prices would then likely be forced to hit at least the 0.96 level, or even the small 4hr demand area below it at 0.95789-0.95937 (tentative buy orders are seen just above at 0.95967). Would we be interested in buying here? Yes, as we feel this area would likely see at least a bounce, but a reversal is very unlikely here since we mustn’t forget where price is located on the higher timeframes (see above). However, lower timeframe confirmation would be needed, and since only a bounce is expected, one would need to likely watch the 5 minute timeframe or lower to get in long early.
Buy/sell levels:
- Buy orders: 0.96333 [Tentative] (Predicative stop-loss orders seen at: 0.96142) 0.95967 [Tentative] (Predicative stop-loss orders seen at: 0.95755).
- Sell orders: 0.96977 (Predicative stop-loss orders seen at: 0.97050) 0.97123 (Predicative stop-loss orders seen at: 0.97545).
XAU/USD (GOLD):
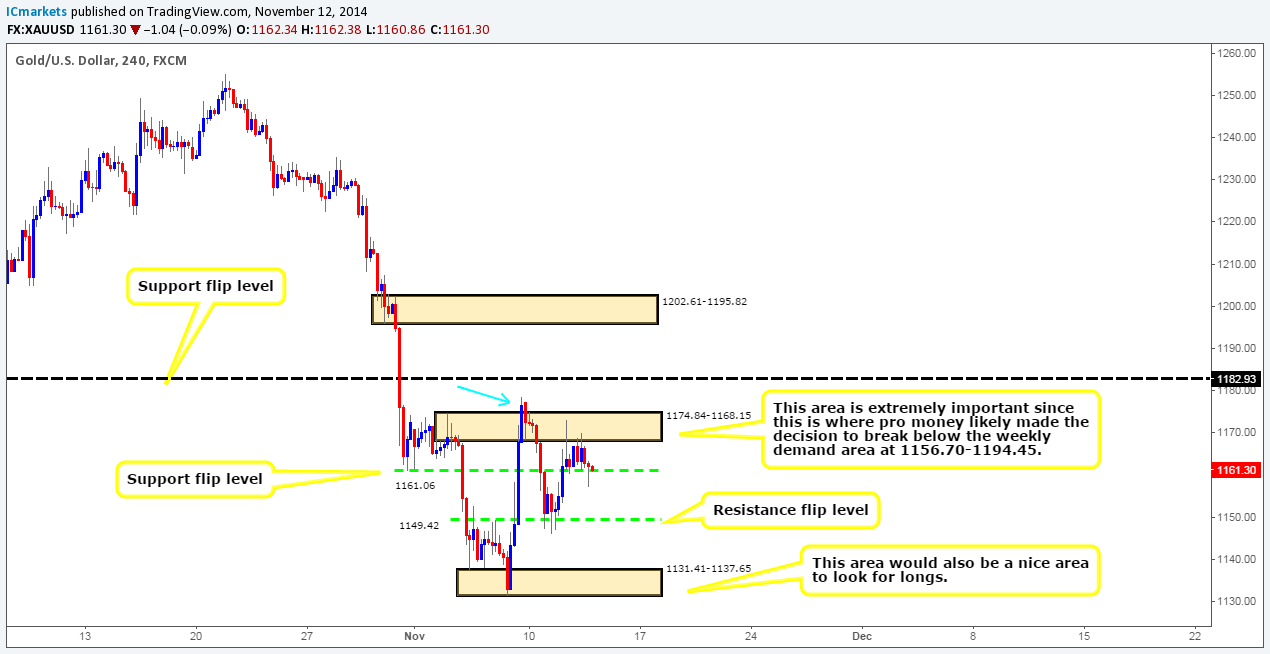
Weekly Timeframe: Traders who bought based off of the bullish weekly pin-bar candle that broke through the weekly demand area at 1156.70-1194.45 last week will still likely be in serious drawdown. Let’s take a look on the lower timeframes to see if any new developments can be seen.
Daily Timeframe: For anyone who read Monday’s analysis on gold, you would have likely resisted buying on the break of that weekly pin-bar candle, as it was reported that all price had effectively done was traded directly towards a major daily support flip level seen at 1182.01. For us to consider buying into this market, a positive close above 1182.01 would be required. It will be interesting to see if there are any short-term opportunities on the 4hr timeframe.
4hr Timeframe: Technically, gold has not seen much movement since the previous analysis. Price appears to be currently resting on a minor 4hr support flip level seen at 1161.06. We expect that this level is weak, and as such a break lower is imminent. This move would likely force prices further south to test 1149.42, a minor 4hr resistance flip level, where tentative buy orders are seen just above at 1150.61. With that being said, trading this level would require some sort of lower-timeframe confirmation, as price could just as easy continue down towards the extreme 4hr Quasimodo support area coming in at 1131.41-1137.65. It would be here that we would be confident buying relatively heavy targeting 1182.93. The reasons for why are as follows (repeated from yesterday’s analysis):
- Sellers have been consumed around a very important (the reason for why it is important is on the chart) 4hr supply area at 1174.84-1168.15 marked with a blue arrow, which likely cleared the path north to around a 4hr support flip level seen at 1182.93 (the daily timeframe shows this as a major daily support flip level – see above).
- Price has yet to hit the above 4hr support flip level, and this is how we want it to stay since it will be a fantastic take-profit target.
- We believe that there are big buy orders lurking around 1138.51, just above the extreme 4hr Quasimodo support area coming in at 1131.41-1137.65, since this area in our opinion represents the origin of the impulsive move north seen on the 07/11/2014. This would be a perfect area to enter long targeting 1182.93 – just look at the potential risk to reward there if we took profit at 1182.93
This set up could take some time to unfold, but for the time being, this is all we’d confidently risk our money on.
Buy/sell levels:
- Buy orders: 1138.51 (Predicative stop-loss orders seen at: 1130.21) 1150.61 [Tentative] (Predicative stop-loss orders seen at: 1145.16).
- Sell orders: N/A (Predicative stop-loss orders seen at: N/A).
Source:: Thursday 13th November: Daily technical outlook and review.


