
Previous Story
Tuesday 11th November: Daily technical outlook and review (U.S/Canada/French Bank holidays today).
Posted On 11 Nov 2014
Comment: 0
EUR/USD:
Weekly Timeframe: After two weeks of consecutive selling, buying interest MAY be seen coming into the market, since a weekly indecision candle formed last week around the base of a combined weekly demand/Quasimodo support area seen at 1.22403-1.24420/1.22866. Assuming that further buying is indeed seen from here, price could possibly trade all the way back up to 1.27541, a weekly support flip level. On the other hand, follow-through selling would effectively force prices deeper into this weekly demand area, potentially trading towards the weekly Quasimodo support level at 1.22866.
Daily Timeframe: For the time being, the daily timeframe shows very little regarding future ‘direction’. Price is currently confined between a small daily supply area at 1.25763-1.24794, and a long-term daily demand area seen at 1.22877-1.23809. It is only once one of these areas is consumed, will we then have some idea on where price is likely to trade to next.
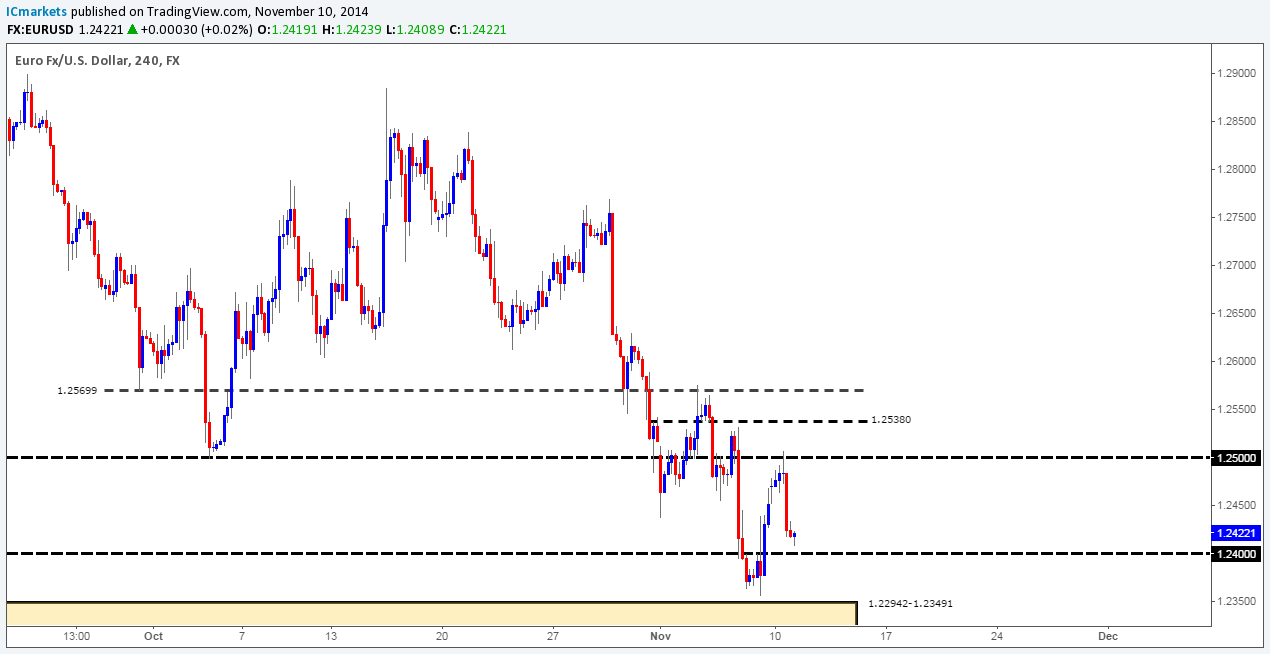
4hr Timeframe: The 4hr timeframe shows that the 1.25 level was a beautiful area to be looking for shorts; we do hope some of our readers took advantage of this move, and have locked in some healthy profits already.
In all honesty we do not feel very comfortable about buying this market at the moment, which seems strange considering price is trading around a major weekly demand area (levels above) at the moment. The reason being is simply because we usually like to see some sort of direction on the daily timeframe before considering a position on the 4hr timeframe, and as we can all see this has yet to be shown. In our opinion, buying the Euro should only be considered if there is supporting lower-timeframe price action in play with clear take-profit targets. The levels/areas we have our eye on currently are 1.24, buy orders may be lurking just above at 1.24057, and also the combined 4hr demand/round number area (located deep within both the higher-timeframe demand zones – see above) seen just below coming in at 1.22942-1.23491/1.23, watch for a reaction around 1.23557.
We must emphasize here once more that entering at the levels mentioned above with only a pending order may not be the best path to take. Waiting for some sort of lower-timeframe confirmation signal is a MUST, as further selling could well be seen deeper into the aforementioned combined weekly demand/Quasimodo support area, that is if the daily supply area at 1.25763-1.24794 continues to hold.
Buy/sell levels:
- Buy orders: 1.24057 [Tentative] (Predicative stop-loss orders seen at: 1.23749) 1.23557 [Tentative] (Predicative stop-loss orders seen at: 1.22894).
- Sell orders: N/A (Predicative stop-loss orders seen at: N/A).
GBP/USD:
Weekly Timeframe: Last week saw the British pound take a tumble resulting in the weekly demand area seen at 1.58533-1.60157 being broken. This move potentially opens the gates for price to challenge 1.57166; a strong-looking weekly resistance flip level. That being said though, we have to take into consideration the fact that price did not actually close below this area, this may in itself indicate a fakeout may have taken place to gather liquidity for higher prices. Let’s take a look on the lower timeframes to see what we can find.
Daily Timeframe: The daily timeframe shows price is currently trapped trading between a minor daily support flip level coming in at 1.58736, and a daily demand area seen at 1.57736-1.58390. In the event that price breaks out north here, we can likely expect prices at least test the daily supply area seen at 1.60210-1.59700. Conversely, a break below would likely attract further selling down towards the aforementioned weekly resistance flip level at 1.57166, which would likely confirm the weekly demand area (levels above) has been fully consumed.
4hr Timeframe: Very similar to the EUR/USD, the GBP/USD has reacted beautifully off of a round-number level seen at 1.59, which was something we had prepared for. Again, we do hope some of our readers caught some of this move south.
Other than the break of the weekly demand area (levels above), we have very little directional price action on this pair. The daily timeframe is currently ranging (see above), which has naturally forced the 4hr candlestick price action to trade between a 4hr demand area at 1.57736-1.58110 (located deep within the aforementioned daily demand zone), and the 1.59 level. Opportunities to trade this market are no doubt here with tentative buys seen at 1.58165, and sells at 1.58972. However, we would strongly advise waiting for some sort of lower-timeframe confirmation signal before pulling the trigger.
Buy/sell levels:
- Buy orders: 1.58165 [Tentative] (Predicative stop-loss orders seen at: 1.57662).
- Sell orders: 1.58972 [Tentative] (Predicative stop-loss orders seen at: 1.59321).
Source:: Tuesday 11th November: Daily technical outlook and review (U.S/Canada/French Bank holidays today).


