
Previous Story
Tuesday 18th November: Daily technical outlook and review.
Posted On 18 Nov 2014
Comment: 0
EUR/USD:
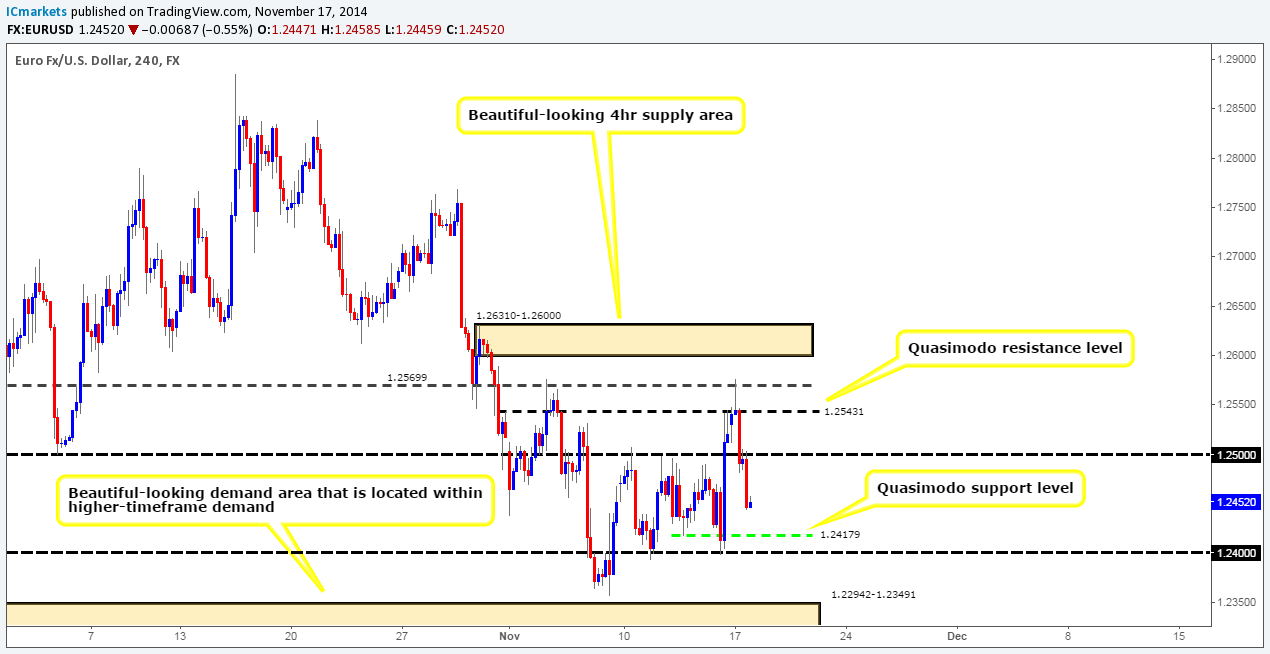
Weekly Timeframe: The weekly timeframe shows that selling interest has come into the market; consequently forcing price back down towards the base of the combined weekly demand/Quasimodo support area at 1.22403-1.24420/1.22866. Let’s see how the lower timeframe price action is structured.
Daily Timeframe: At the time of writing, price still remains capped between a daily supply area at 1.25763-1.24794, and a long-term daily demand area seen at 1.22877-1.23809. A break of one of the above areas will likely give us confirmed direction on where price is headed next, and until that happens, our bias will remain neutral on this timeframe. That does not mean however there are no short-term opportunities to take advantage of on the 4hr timeframe.
4hr Timeframe: The 4hr timeframe shows that the market opened 11 pips higher than Friday’s close (1.25207) at 1.25312. Following this, the EUR/USD rallied but found the 1.25699 level to be resistive enough to allow sellers back into the market. The momentum south forced price below the round-number level 1.25, and gave traders an opportunity to short the retest if quick enough to spot it. The next key area to watch for potential buyers is around 1.24216, just above a 4hr Quasimodo support level at 1.24179. That being said though, we personally would not enter here with a pending buy order; lower timeframe confirmation would be required as we mustn’t forget that we currently have very little direction from the higher timeframes, so trade with caution.
Buy/sell levels:
- Buy orders: 1.24216 [Tentative] (Predicative stop-loss orders seen at: 1.23892).
- Sell orders: N/A (Predicative stop-loss orders seen at: N/A).
GBP/USD:
Weekly Timeframe: The weekly timeframe shows that the buyers did indeed come into the market around the upper limits of a weekly demand area at 1.54260-1.56110. However, the selling opposition around the weekly resistance flip level lurking just above at 1.57166 seems to be too strong to overcome at the moment.
Daily Timeframe: Buyers and sellers are currently seen battling it out within a daily-decision-point demand area at 1.55602-1.56802 (located within the aforementioned weekly demand area). As mentioned in the previous analysis, a close above 1.57166 would need to be seen before we would consider taking a longer-term buy position on the pound. It will be interesting to see if there are any shorter-term opportunities on the 4hr timeframe.
4hr Timeframe: A push above (blue arrow) a very important combined 4hr supply/round-number area at 1.57208-1.56927/1.57 (surrounding the weekly resistance flip level at 1.57166) was seen a few hours after the open (1.56808). The reason for its importance is simply because it is within this area that pro money likely made the decision to initially break below the aforementioned weekly resistance flip level. The break higher has potentially given us short-term direction, since the path north is likely now clear up to a 4hr supply area coming in at 1.57804-1.57578.
We feel there is a good chance that there are active orders sitting around 1.56166, just above a 4hr Quasimodo support level at 1.56150, which is where will be placing our pending buy order. Our stop will be placed below the long-term 4hr support level (1.55737) at 1.55633, and our first take-profit target will be set at 1.57526, just below the 4hr supply area mentioned above at 1.57804-1.57578.
Buy/sell levels:
- Buy orders: 1.56166 (Predicative stop-loss orders seen at: 1.55633).
- Sell orders: N/A (Predicative stop-loss orders seen at: N/A).
AUD/USD:
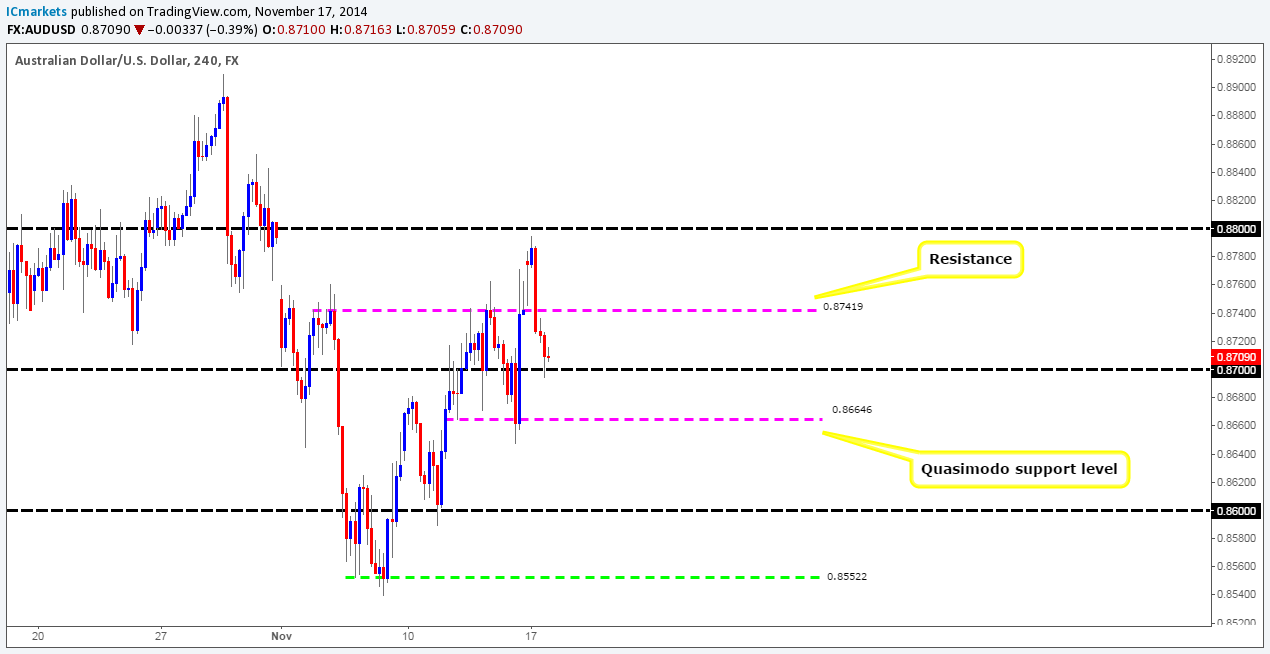
Weekly Timeframe: The weekly timeframe currently shows that the buyers and sellers are battling it out between an ignored weekly Quasimodo support level seen at 0.88189, and a weekly Quasimodo support level below coming in at 0.85769. It will be interesting to see what the lower timeframes show.
Daily Timeframe: The daily timeframe reveals that price reacted beautifully of off a daily supply area at 0.88531-0.87942 yesterday. The path south from here appears to be relatively clear back down to a major daily resistance flip level at 0.85504, since most of the demand appears to have already been consumed – check out the demand consumption tails seen at 0.86472/0.85895.
4hr Timeframe: The 4hr timeframe shows that unfortunately there was no reversal around the market open (0.87776), meaning that we could not buy into the market as planned targeting around 0.88 (see previous analysis for details).
Active sellers came into the market at around 0.87948, consequently forcing price down towards 0.87. Assuming that the buyers can hold out above here, a test of 0.87419 may well be seen soon, where at which point we’ll be watching the lower-timeframe price action for an entry short around 0.87398. However, in the event that a break lower is seen here, we will then be watching the 4hr Quasimodo support level coming in at 0.86646 looking for potential short-term buying opportunities on the lower timeframes around 0.86688.
Buy/sell levels:
- Buy orders: 0.86688 [Tentative] (Predicative stop-loss orders seen at: 0.86439).
- Sell orders: 0.87398 [Tentative] (Predicative stop-loss orders seen at: 0.87667).
USD/JPY:
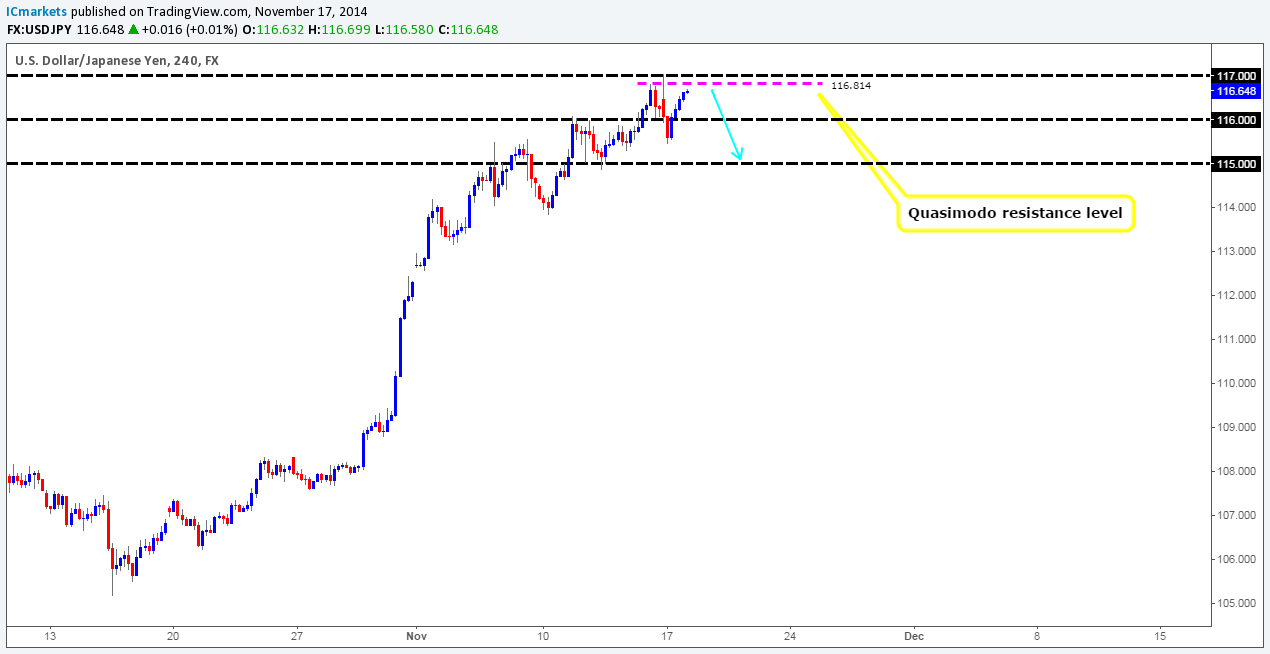
Weekly Timeframe: The USD/JPY pair continues to trade around a major weekly supply area (117.931-116.799) at the moment. Let’s take a look on the lower timeframes to see how price is structured.
Daily Timeframe: It was mentioned in the previous analysis that further buying could indeed be seen up to a daily Quasimodo resistance level at 117.120 (located within the aforementioned weekly supply area), before serious sellers entered into the market. As we can all see, this has indeed happened, let’s take a look on the 4hr timeframe to see if there are any opportunities to sell.
4hr Timeframe: Our bias for this market is very much short considering where price is located in the higher-timeframe picture (see above). With that being said, we feel that there is a potential shorting opportunity currently being seen around 116.771, just below a 4hr Quasimodo resistance level at 116.814. Our stop-loss order will be placed quite a few pips above the round number (117) at 117.270 to avoid any fakeouts that may occur. First troublesome demand area to be watchful of is around 115.608, and the first-take-profit target for us will be set at 115.089, just above the round-number level 115.
Buy/sell levels:
- Buy orders: N/A (Predicative stop-loss orders seen at: N/A).
- Sell orders: 116.771 (Predicative stop-loss orders seen at: 117.270).
EUR/GBP:
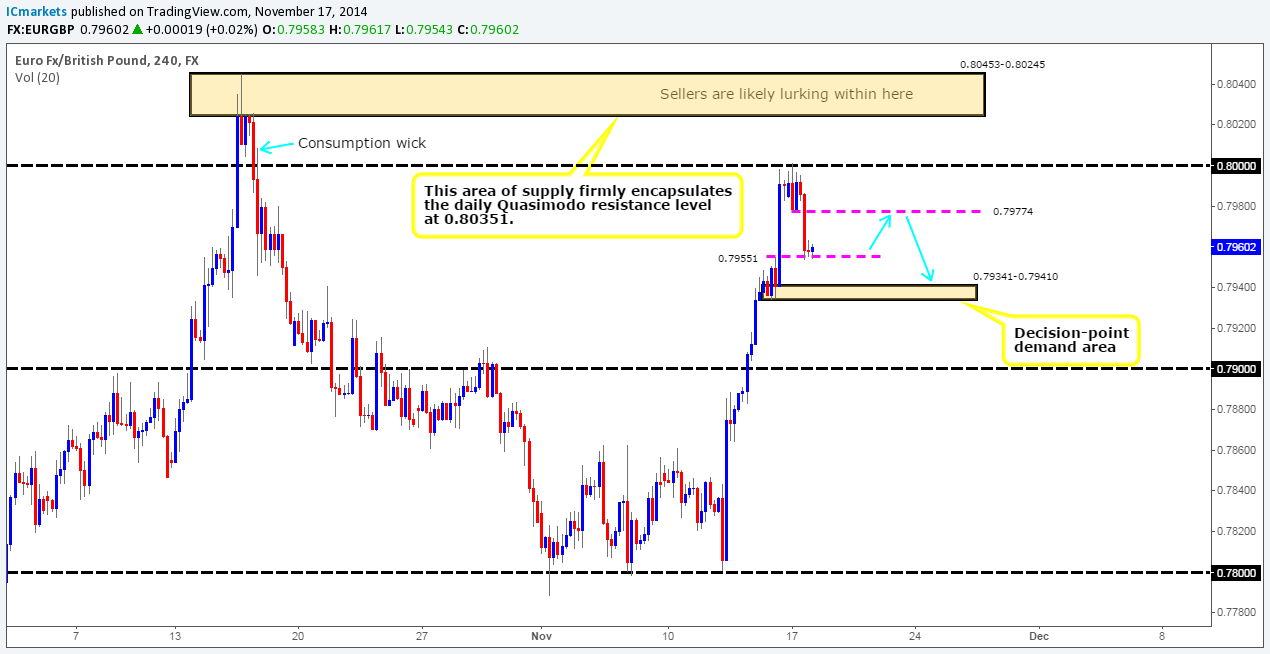
Weekly Timeframe: At the time of writing, the weekly timeframe shows price is firmly trading in between a major weekly demand area at 0.76931-0.78623, and a weekly Quasimodo resistance level coming in at 0.80328.
Daily Timeframe: The daily timeframe reveals that the sellers were clearly the ones in control yesterday, as price reacted nicely off of a minor daily resistance level coming in at 0.79963, just a few pips below the humongous psychological figure 0.8.
4hr Timeframe: The 4hr timeframe shows that the 0.8 level held up beautifully. We do hope some of our readers got in short here, as there was a very nice confirmed entry on the hourly timeframe to enter short with low risk targeting the 4hr decision-point demand area at 0.79341-0.79410 (as mentioned in the previous analysis). However, before price reaches the overall target, we feel there may be another short-term selling opportunity around 0.79774, if the buyers have enough steam to push price off of 0.79551 that is. For anyone considering entering short if/when price reaches 0.79774, please do wait for some sort of confirmation on the lower timeframes, as there is nothing worse than price gobbling up your stop with a fakeout spike only then to move in your favor.
Buy/sell levels:
- Buy orders: N/A (Predicative stop-loss orders seen at: N/A).
- Sell orders: N/A (Predicative stop-loss orders seen at: N/A).
USD/CAD:
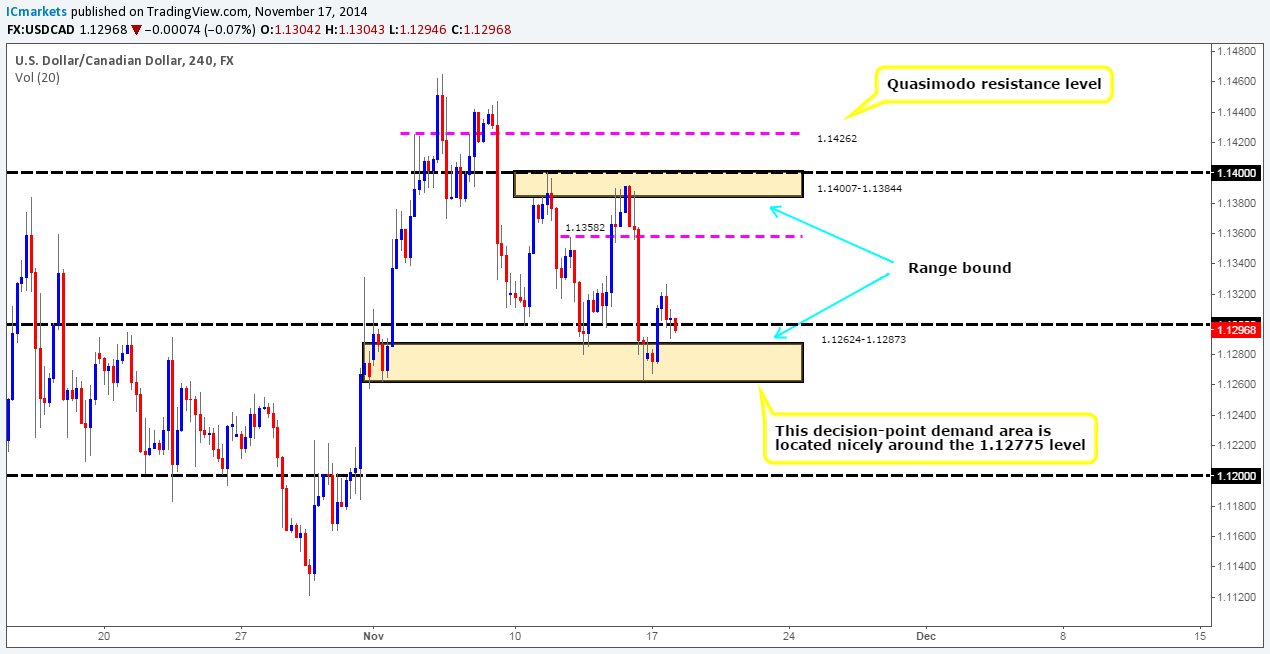
Weekly Timeframe: The buyers still seem to be still holding their ground just above the medium-term weekly high 1.12775. Our bias will remain long on this pair, and will only change if price closes below this level. Let’s see what we can find on the lower timeframes.
Daily Timeframe: In our honest opinion, the daily timeframe is not exactly showing buying strength at the moment, since the 1.13110 barrier is currently holding the market lower. A daily close above this level is what we are ideally looking for at the moment.
4hr Timeframe: The 4hr timeframe still shows price is range bound between a combined 4hr supply/round-number area coming in at 1.14007-1.13844/1.14, and a 4hr decision-point demand area seen at 1.12624-1.12873 (encapsulates the 1.12775 weekly level). However, within this range we are ideally looking for buying strength. Yesterday saw a full-bodied bullish candle close above the round-number level 1.13, if price can successfully hold above here, then there’s very little stopping prices from rallying to a mid-range Quasimodo resistance level coming in at 1.13582, which will likely be enough to encourage further buying on the higher timeframes. If one can spot good lower-timeframe price action around 1.13, it may be worth trading a small position long, targeting the aforementioned Quasimodo resistance level.
Buy/sell levels:
- Buy orders: N/A (Predicative stop-loss orders seen at: N/A).
- Sell orders: N/A (Predicative stop-loss orders seen at: N/A).
USD/CHF:
Weekly Timeframe: The weekly timeframe still shows price is capped between a weekly supply area coming in at 0.98378-0.95895, and a weekly resistance flip level seen at 0.94546.That being said though, most of the trading action for the past few weeks has been taking place within the weekly supply area, so any buy trades initiated on this pair will require strict trade management rules.
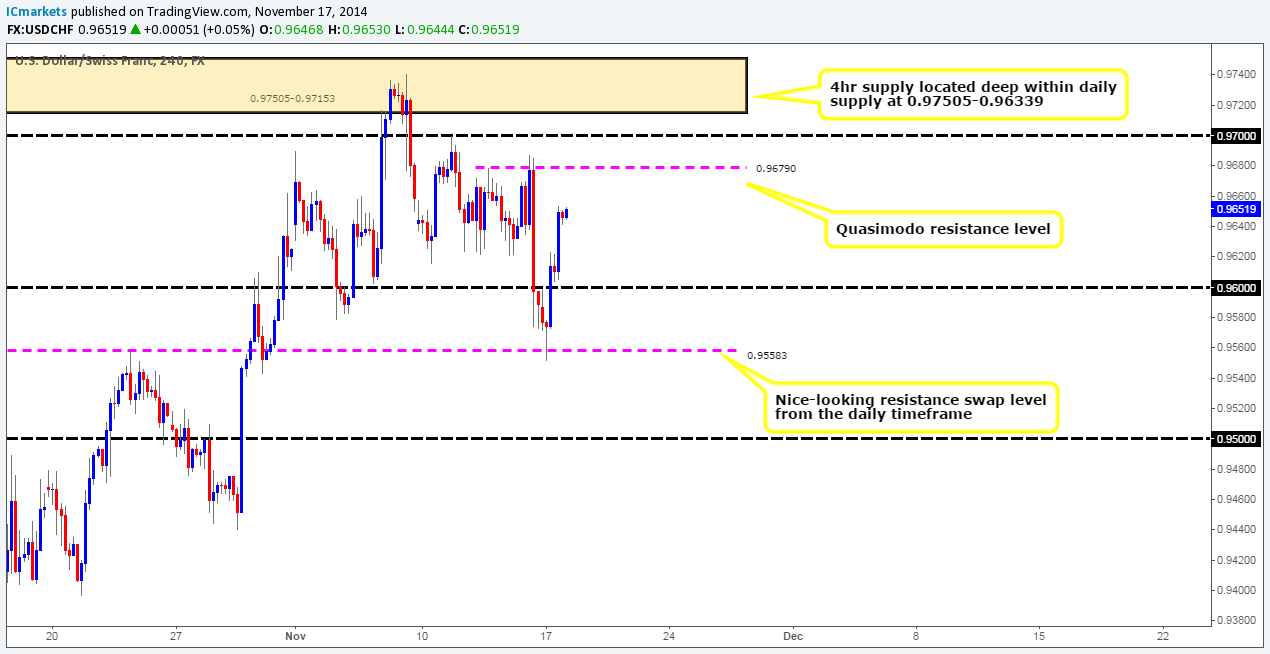
Daily Timeframe: The daily timeframe shows that price clearly has reacted off of a daily resistance flip level seen at 0.95583, and has at the time of writing pushed prices back up to a major daily supply area at 0.97505-0.96339 (located within the aforementioned weekly supply area). Let’s see what the 4hr timeframe will offer us.
4hr Timeframe: The 4hr timeframe shows that price did indeed retest around 0.96 before dropping towards 0.95583, which was mentioned may happen in the previous analysis. One would have needed to be very quick though to catch this short trade, as it formed around the opening candle (0.95875).
We are certainly not going to be initiating any long trades unless presented with perfect-looking lower timeframe confirmation. With that in mind, near-term selling opportunities are currently being seen around 0.96742, just below a nice-looking 4hr Quasimodo resistance level coming in at 0.96790, which will in our opinion require price action confirmation on the lower timeframes to avoid any potential fakeout. We also have our eye on the 4hr supply area seen above at 0.97505-0.97153 (located very deep within the aforementioned major daily supply area), with sell orders seen just below at 0.97138 – again we would recommend waiting for some confirmation on the lower timeframes here since this area has already been visited once indicating potential weakness.
Buy/sell levels:
- Buy orders: N/A (Predicative stop-loss orders seen at: N/A).
- Sell orders: 0.96742 [Tentative] (Predicative stop-loss orders seen at: 0.96896) 0.97138 [Tentative] (Predicative stop-loss orders seen at: 0.97534).
XAU/USD (GOLD):
Weekly Timeframe: The weekly timeframe shows yet another buying tail formed last week just above a small weekly decision-point demand level at 1136.30. We see very little in the way stopping prices from rallying higher up to 1244.08 sometime this week or the next. Let’s take a look on the lower timeframes to see what we can find.
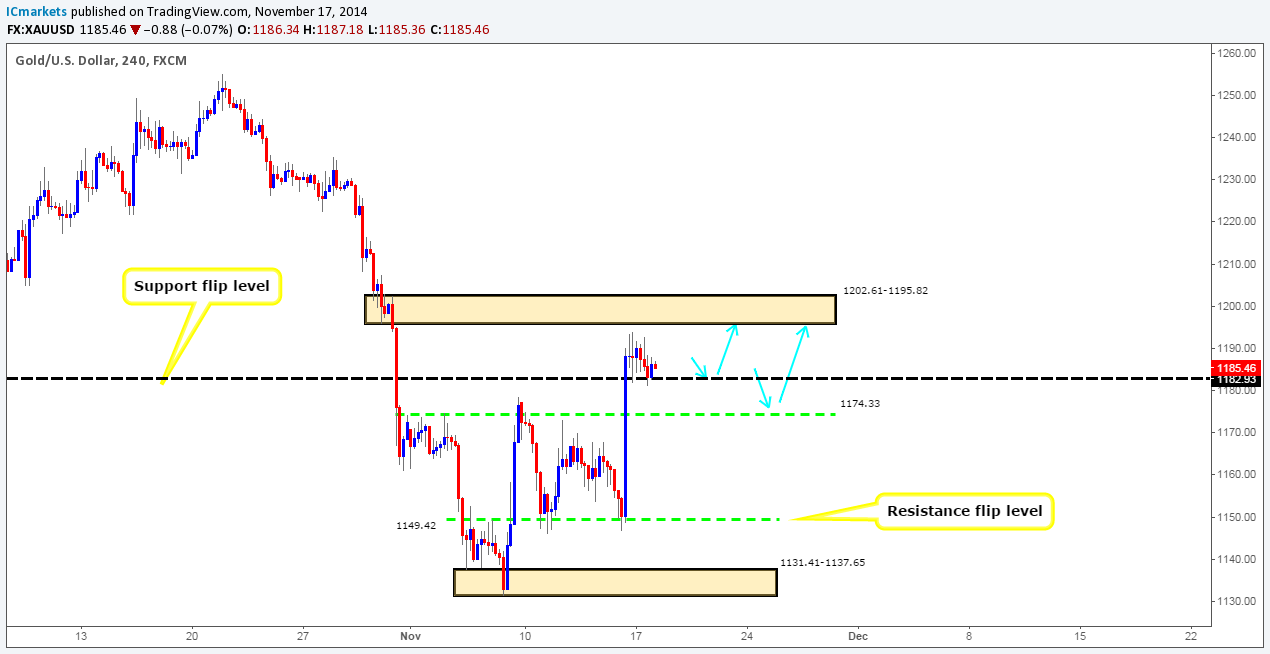
Daily Timeframe: A close above a major daily support flip level at 1182.01 was seen last week, which has potentially confirmed direction up to around a daily supply area coming in at 1235.51-1222.37, and at the same time confirmed buying strength from the aforementioned weekly decision-point demand area. Ultimately, what we are looking for now is some sort of candle formation around the daily support flip level to indicate further buyer will likely ensue.
4hr Timeframe: The 4hr timeframe shows that gold has not seen much movement since the markets opened (1188.29). However, for anyone who read our previous analysis on gold, we reported that there was likely going to be an opportunity to scalp long around the 4hr support flip level at 1182.93, with the possibility of holding some of your position up to a 4hr supply area at 1202.61-1195.82 and possibly beyond. The reason being is simply because we currently have bullish price action on the higher timeframe picture (see above) at the moment, meaning larger moves are expected to be seen north.
With that being said, as the blue arrows indicate, price could very well slide down towards a 4hr resistance flip level coming in at 1174.33 from here, where once again we will be watching lower-timeframe price action around 1175.75 for an entry long, targeting the aforementioned 4hr supply area first and foremost.
Buy/sell levels:
- Buy orders: 1175.75 [Tentative] (Predicative stop-loss orders seen at: Dependent on how one confirms the level).
- Sell orders: N/A (Predicative stop-loss orders seen at: N/A).
Source:: Tuesday 18th November: Daily technical outlook and review.


