Previous Story
Daily analysis of USDX for January 12, 2018
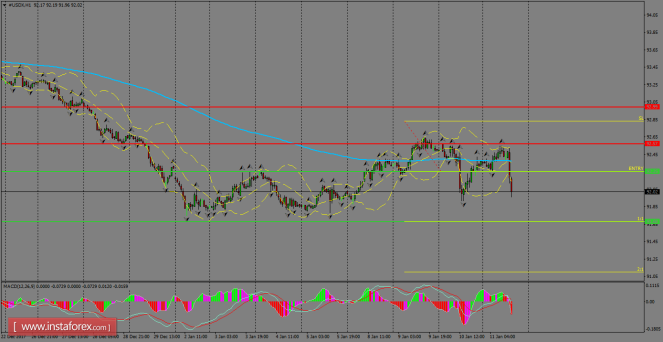
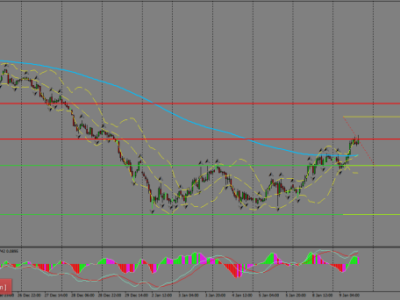
USDX continues to trade in a bearish bias below the 200 SMA, as the index managed to find dynamic resistance in the 200 SMA at the H1 chart. The nearest support lies at the 91.68 level and it’s possible that in coming hours, the index could test that zone. MACD indicator is entering the negative territory, calling for another leg lower.
H1 chart’s resistance levels: 92.57 / 93.00
H1 chart’s support levels: 92.25 / 91.68
Trading recommendations for today: Based on the H1 chart, place sell (short) orders only if the USD Index breaks with a bearish candlestick; the support level is at 92.25, take profit is at 91.68 and stop loss is at 92.83.
The material has been provided by InstaForex Company – www.instaforex.com