
Previous Story
Daily analysis of GBP/USD for February 15, 2017
Posted On 15 Feb 2017
Comment: 0
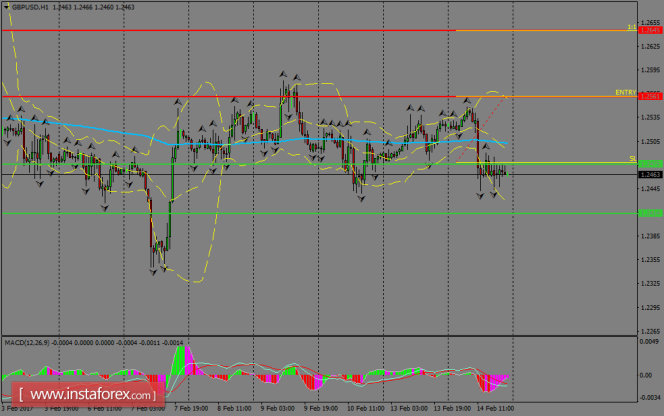
GBP/USD plummeted to consolidate once again below the 1.2500 zone and now, we’re seeing some choppy price action around the 1.2450 level. If the pair manages to break above 1.2500, then we can expect further rallies to test the resistance zone of 1.2561. However, that move should be taken as bears’ giving up in a temporal way.
H1 chart’s resistance levels: 1.2561 / 1.2645
H1 chart’s support levels: 1.2475 / 1.2414
Trading recommendations for today: Based on the H1 chart, buy (long) orders only if the GBP/USD pair breaks a bullish candlestick; the resistance level is at 1.2561, take profit is at 1.2645 and stop loss is at 1.2480.
The material has been provided by InstaForex Company – www.instaforex.com


