Previous Story
Elliott Wave analysis of BTC/USD for 11/04/2019
Technical market overview:
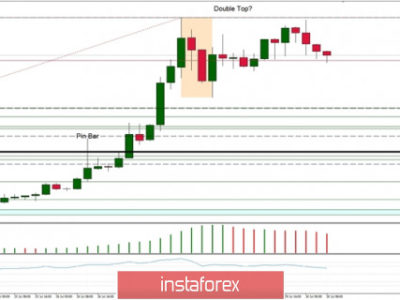
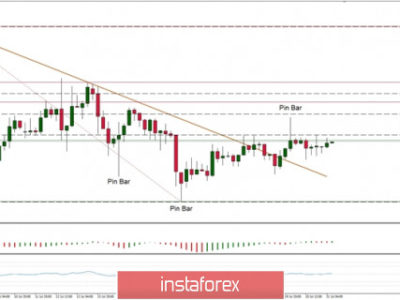
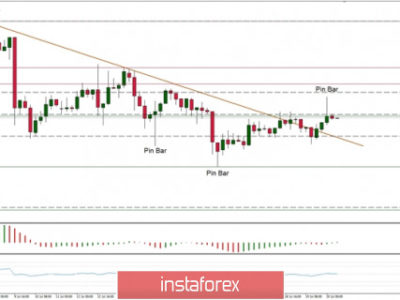
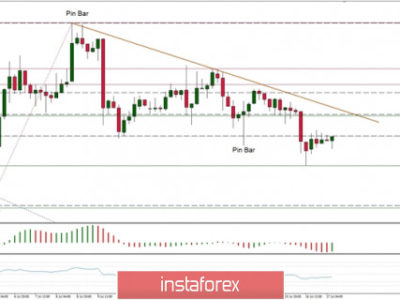
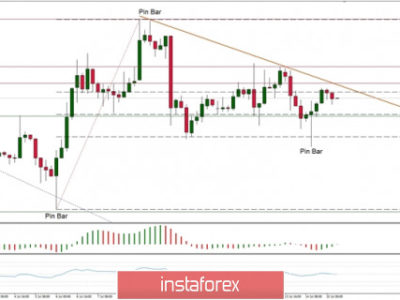
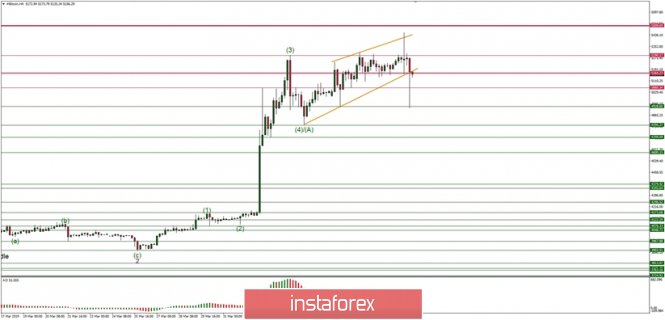
The BTC/USD pair might have completed the Ending Diagonal pattern in wave (5) because the lower orange trendline was clearly violated: the price has broken below the level of $5,164 and went down towards the level of $5,060. Even this level was not good enough for bears and they pushed the price to the technical support at the level of $4,928. The long upper and lower shadows indicate there is still a battle going on, but from the Elliott Wave theory point of view, we have entered the corrective cycle.
Weekly Pivot Points:
WR3 – $6,920
WR2 – $6,094
WR1 – $5,671
Weekly Pivot – $4,832
WS1 – $4,470
WS2 – $3,620
WS3 – $3,234
Trading recommendations:
The long-term buy orders might be coles now as the five waves impulsive structure looks now completed with a top at the level of $5,451. Only sell orders should be opened now with a protective stop loss placed just above the top. The targets are $5,060 and $4,928 again.
The material has been provided by InstaForex Company – www.instaforex.com