
Previous Story
Technical analysis for Gold for April 11, 2019
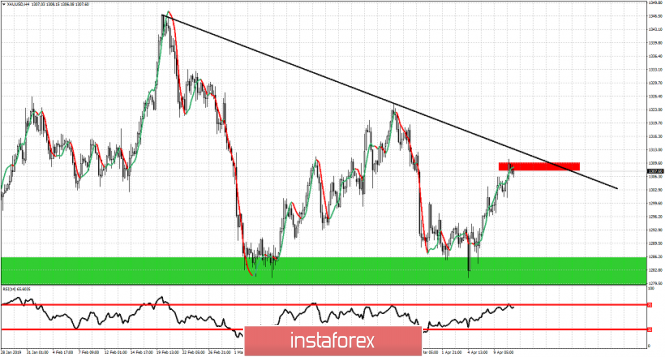
Gold price continued its upward move towards our first short-term target of $1,310-15 area. Price back tested the support area at $1,300 and bulls confirmed their control of the short-term trend by staying above $1,300. In our previous analysis, we warned about the bullish divergence signs and that if price were to recapture $1,300, we should at least see a bounce towards $1,315.
Black line – major trend line resistance
Red rectangle -target area
Green rectangle – major support
Gold price has bounced off the green support area. Inability to break below $1,290-80 combined with the bullish divergence signals, made us expect last week a bounce were to follow. Most probable target area was noted with a red rectangle just below the black downward sloping trend line. This target has now been achieved. A rejection at current levels would be a bearish sign for Gold bulls. However as long as price is above the green rectangle area bulls have hopes of seeing more upside. Breaking above the black trend line would be an important bullish sign but confirmation of a stronger move higher will come on a break above $1,324.50.
The material has been provided by InstaForex Company – www.instaforex.com


