
Previous Story
Ethereum Elliott Wave analysis for 15/03/2019
Technical Market Overview:
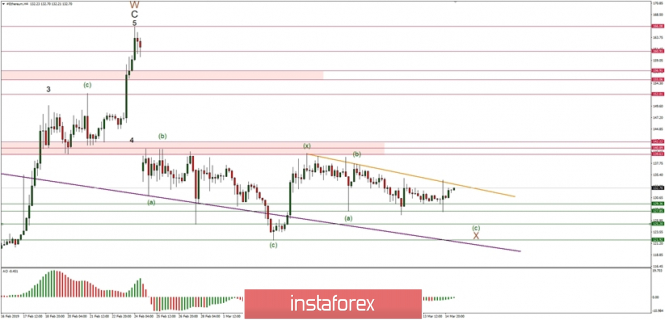
The ETH/USD pair might be still unfolding into a more complex and time-consuming pattern because bulls were not able to break through the technical resistance zone located between the levels of 139.63 – 142.22. Moreover, the pair is still trading below the orange trend line, so the bears are still in control over the market. The market is then still unfolding the corrective cycle and the most probable pattern is a Double Three corrective cycle, which needs one more wave to the downside in order to complete the cycle. The first target for this wave is seen at the level of 125.20 and below at 121.92. Any breakout above the trendline will invalidate the downside scenario.
Weekly Pivot Points:
WR3 – 160.89
WR2 – 150.37
WR1 – 143.35
Weekly Pivot – 132.11
WS1 – 124.46
WS2 – 114.39
WS3 – 108.32
Trading Recommendations:
Only sell orders should be open as close as possible to the level of 134.00 The protective stop-loss orders should be placed at 134.81 level as any violation of this level will invalidate the short-term bearish outlook. The first target is seen at the level of 125.20, then at 121.92. Any violation of the wave X low at the level of 121.92 will confirm the bearish outlook.
The material has been provided by InstaForex Company – www.instaforex.com


