
Previous Story
Ethereum Elliott Wave analysis for 23/01/2019
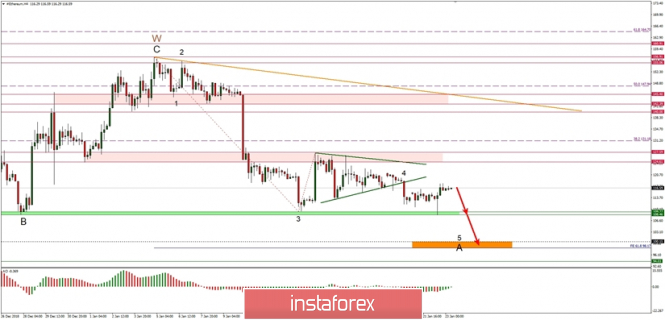
Ethereum Elliott Wave analysis for 23/01/2019:
The market has tested the technical support again
Technical market overview:
After the triangle breakout to the downside, the price has tested the technical support at the level of 108.46 and bounced towards the level of 116.80. This market behavior indicates the bulls are defending the support yet again and the price might develop a more complex and time-consuming pattern in wave 4 (which would have bee still in progress) or the wave 5 has been completed sooner than expected at the level of 108.46 instead at the projected target at the level of 100.15.
The larger time frame trend remains bearish on monthly, weekly and daily time frame charts, so the bears still have control over the market. This is why any upside price developments should be considered as a local correction in a downtrend only. Technical levels to keep an eye on are: support zone between the levels of 108.46 – 109.37 and resistance zone between the levels of 124.61 – 127.59.
Recommendations:
The downside cycle has not been completed yet so the sell orders should still be in play as long as the level of 121.38 is not clearly violated. Targets for bears are seen at the level of 109.37, 108.46 and in a case of a further sell off – 100.15-98.80.
The material has been provided by InstaForex Company – www.instaforex.com


