
Previous Story
Ichimoku indicator analysis of USDX for June 28, 2017
Posted On 28 Jun 2017
Comment: 0
Selling pressure in the US dollar index pushed it below the important resistance levels opening the way for a move towards 95-94. The trend is clearly bearish on all time frames.
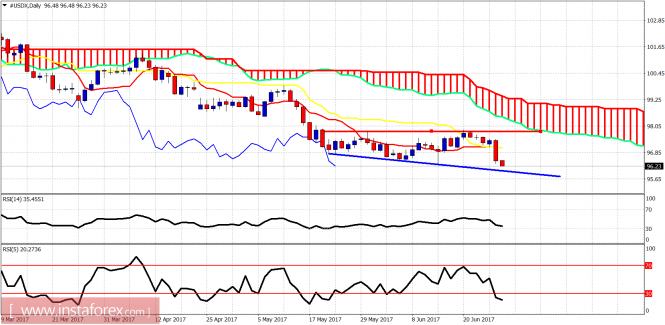
Red line – resistance
Blue line – support
Price has broken below the Tenkan- and Kijun-Sen on the daily chart. The index has been forming something like a megaphone for the last few weeks and this provides a support at 95.70. However, I believe that the move that started just below 98 last week is not going to stop there but much lower. The consolidation of the last few weeks is being broken downwards.
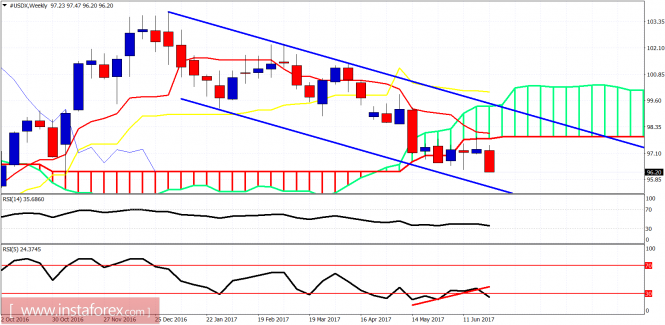
Blue lines – bearish channel
The rejection from the Ichimoku cloud was a stronger bearish signal than the bullish divergence by the RSI(5). The trend remains bearish as a new weekly low is made. We have to wait and see if the RSI indicators provide a new low or a new divergence.
The material has been provided by InstaForex Company – www.instaforex.com
Source:: Ichimoku indicator analysis of USDX for June 28, 2017


