
Previous Story
Light trading seen on the Euro, high-impacting news will likely support a break out of the current consolidation
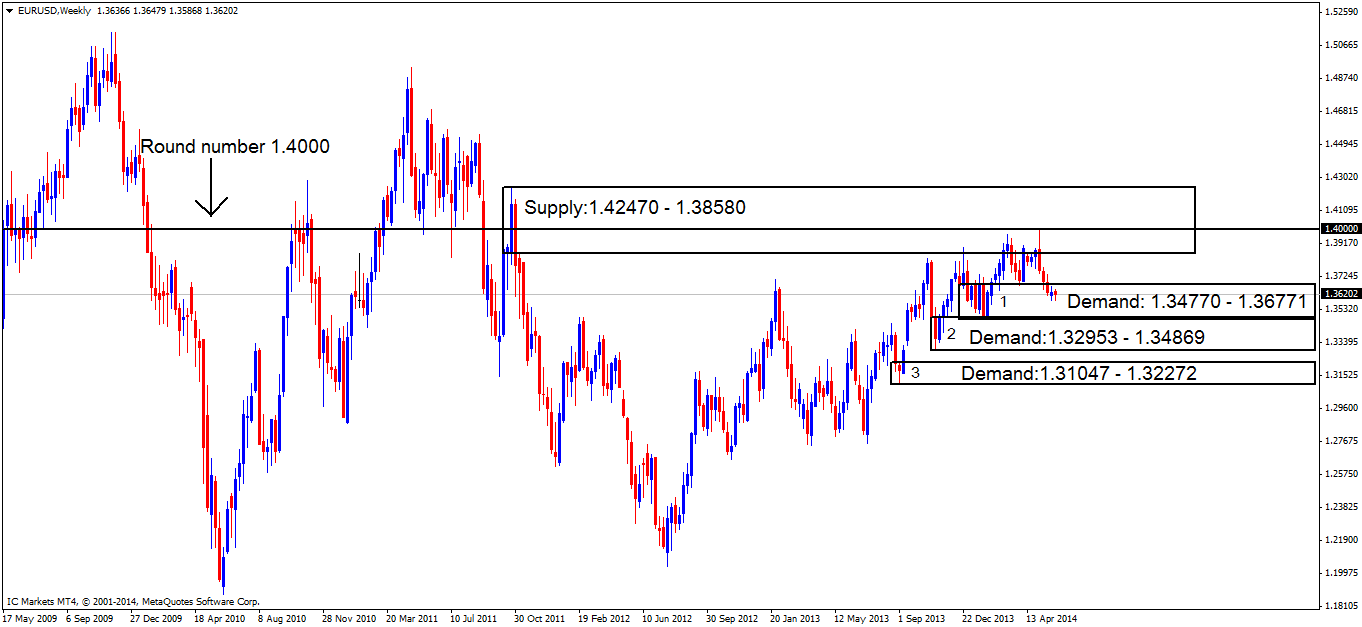
EUR/USD:
Weekly/4hr TFs.
The Euro has been a frustrating pair to trade recently, with price movements being capped between demand at 1.35623 – 1.35984 and supply at 1.36697 – 1.36542. Today’s schedule is full of high-impacting news announcements, where we will likely see a break of the supply area just mentioned above.
A range such as what we are seeing normally means pro money is accumulating positions. Do not forget, these well-funded traders cannot just enter and exit the market as we do. Considering that we are quite deep within weekly demand shown on the chart below, pro money are likely ‘accumulating’ orders to go long i.e. buying in small batches to traders who are selling with the present bearish momentum, hence the range forming on the 4hr timeframe.
- The buy order 1.35984 worked well, and hit its target. New buy orders are seen lower within demand at 1.35774 (marked with a red dashed line), as we want the best chances to trade alongside pro money and they require the best prices.
- Sellers are still likely active around the supply area at 1.36687 – 1.36542, so a bearish reaction will likely be seen there, but do bear in mind the reaction may only be minimal, so be ready to exit at the first sign of trouble. Sell orders remain unchanged from yesterday at the base of supply (1.36687 – 1.36542) at 1.36542. If a break above the supply area just mentioned happens, this could force price to test supply at 1.37235 –1.37005 allowing sell orders to be placed above the round number at 1.37005.
- Areas to watch for buy orders: 1.35774 (SL: 1.35583 TP: [1] 1.36432 [2] 1.36968 [3] 1.37419).
- Areas to watch for sell orders: 1.36542 (SL: 1.36741 TP: 1.36000). Impending orders: 1.36968 (SL: 1.37289 TP: Dependent on future price approach).
- Most likely scenario: Price will likely spike south into demand at 1.35623 – 1.35984, before seeing the buyers take control and push prices north to at least the supply area at 1.36687 – 1.36542.
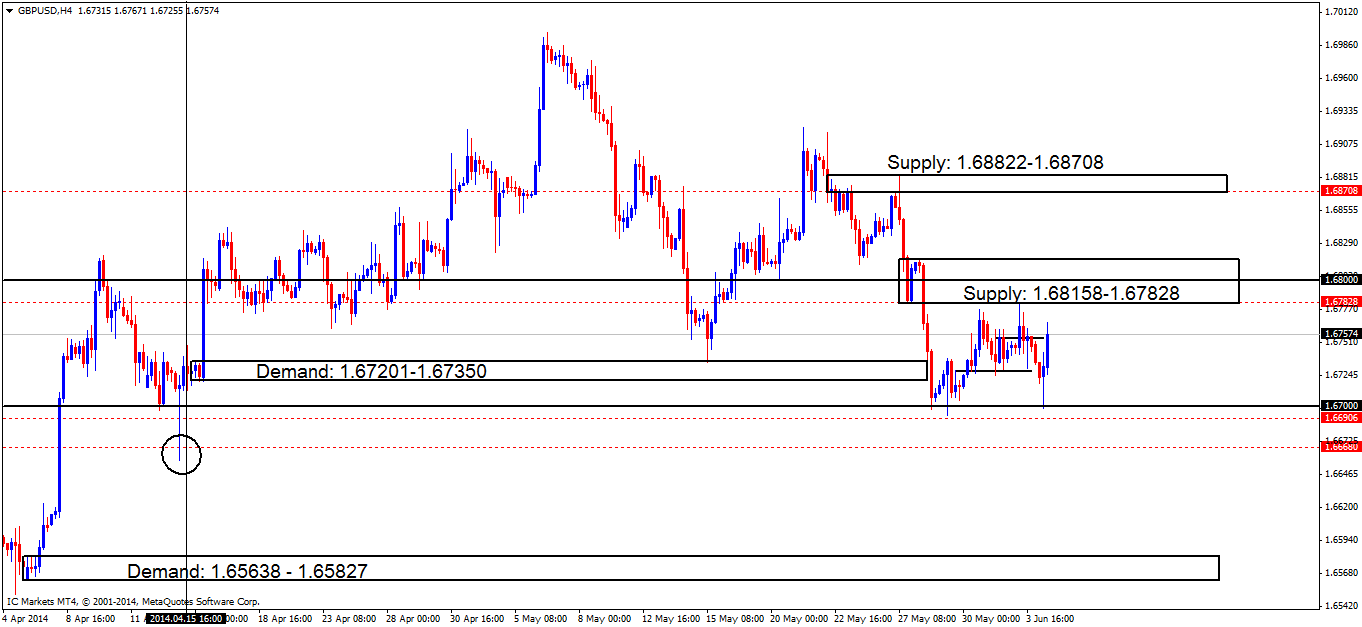
GBP/USD:
4hr TF.
The pound saw a decent drop in value, spiking the round number 1.67000. Price still remains capped between the round number just mentioned and supply above at 1.68158 – 1.67828. Notice how easily price dropped through previous price action happened, this was because of the way price approached supply (levels above) by essentially spiking lower while rallying price north, consuming buyers, clearing the path for a likely sell off which did happen.
- Buy orders remain the same (marked with red-dashed lines) at 1.66906 below the round number 0.67000 which was nearly filled, missing the order by about 8 pips. As explained yesterday, a likely break below the round number mentioned above could see price testing the daily S/R flip level at 1.66631, permitting the need for a buy order set just above at 1.66680.
- Sell orders (marked with red-dashed lines) remain the same as yesterday; the near-term sell orders are seen around supply (1.68158 – 1.67828) at 1.67828. If a break is seen above this capped supply area at 1.68158 – 1.67828, this could force price to test the supply area at 1.68822 – 1.68708. Sell orders could then be set at 1.68708.
- Areas to watch for buy orders: 1.66906 (SL: 1.66534 TP: [1] 1.67828 [2] 1.68708). Impending orders: 1.66680 (SL: 1.66534 TP: Dependent on future price approach).
- Areas to watch for sell orders: 1.67828 (SL: 1.68216 TP: 1.67000). Impending orders: 1.68708 (SL: 1.68860 TP: Will be decided on future price approach).
- Most likely scenario: Similar to the last analysis, a drop in price is still favorable due to higher-timeframe influence, however a spike to either supply area above may happen, the lowest seen at 1.68158 – 1.67828, the highest at 1.68828 – 1.68708.
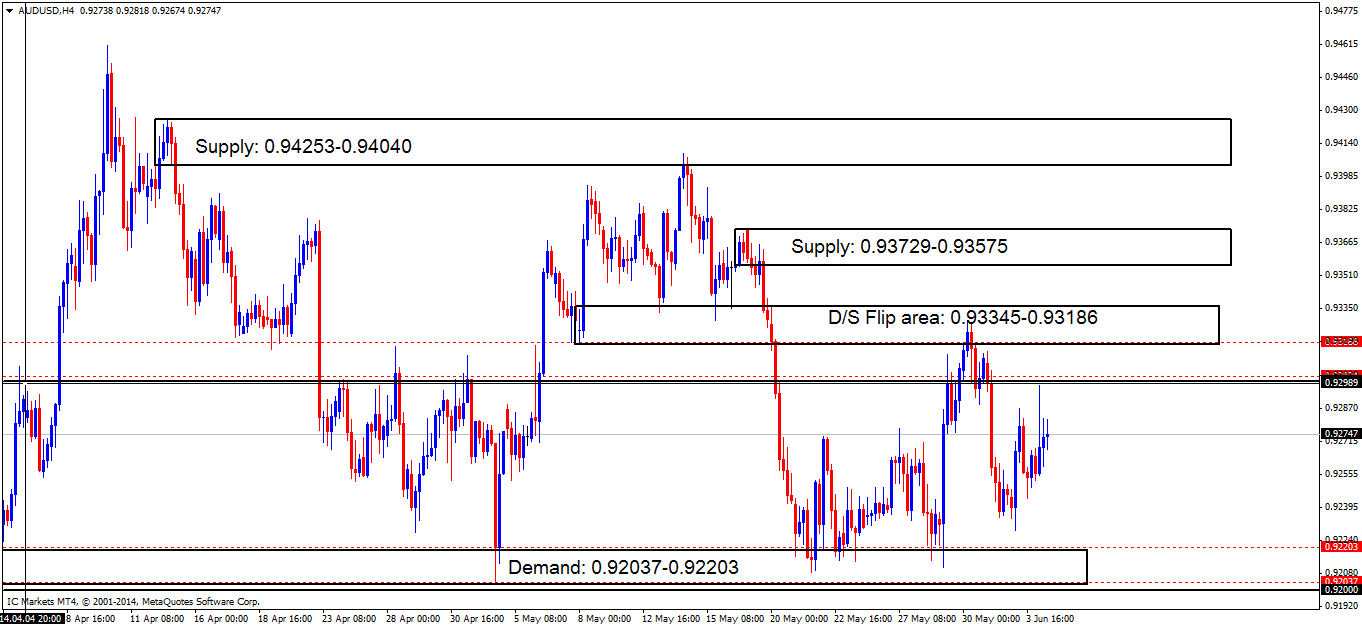
AUD/USD:
4hr TF.
The capped area has yet to see a breach of either supply (0.93345 – 0.93186) or demand (0.92037 – 0.92203). An attempt to test the round number 0.93000 was seen, clearly supply around this area is very strong as the buyers were unable to touch the level, let alone consume it.
- Buy orders (marked with red-dashed lines) are still seen at 0.92203 around the demand area below (0.92037 – 0.92203). Due to the amount of touches this demand area has seen over the recent weeks, pro money may decide to push price lower on its next visit, testing the lower limits of the demand area, so buy orders are seen just above the round number(0.92000) at 0.92037.
- Sell orders (marked with red-dashed lines) are set at 0.93186 around the supply area above (0.93345-0.93186). Due to recent price action (briefly mentioned above), new sell orders are seen just above the round number 0.93000 at 0.93027.
- Areas to watch for buy orders: 0.92203 (SL: 0.91942 TP: [1] 0.93000 [2] 0.93186) 0.92037 (SL: 0.91942 TP: [1] 0.93000 [2] 0.93186).
- Areas to watch for sell orders: 0.93186 (SL: 0.93381 TP: [1] 0.93000 [2] Dependent on the way price action approaches this area but will likely be at 0.92203 ) 0.93027 (SL: 0.93381 TP 0.92203)
- Most likely scenario: Due to higher-timeframe influence, selling seems to be in order at the moment. Pro money will likely spike north above the round number 0.93000 triggering sell orders at the D/S flip area at 0.93345 – 0.93186, for an overall bigger push down, bullish reactions are expected around the demand area at 0.92037 – 0.92203.
USD/JPY:
Daily/4hr TFs.
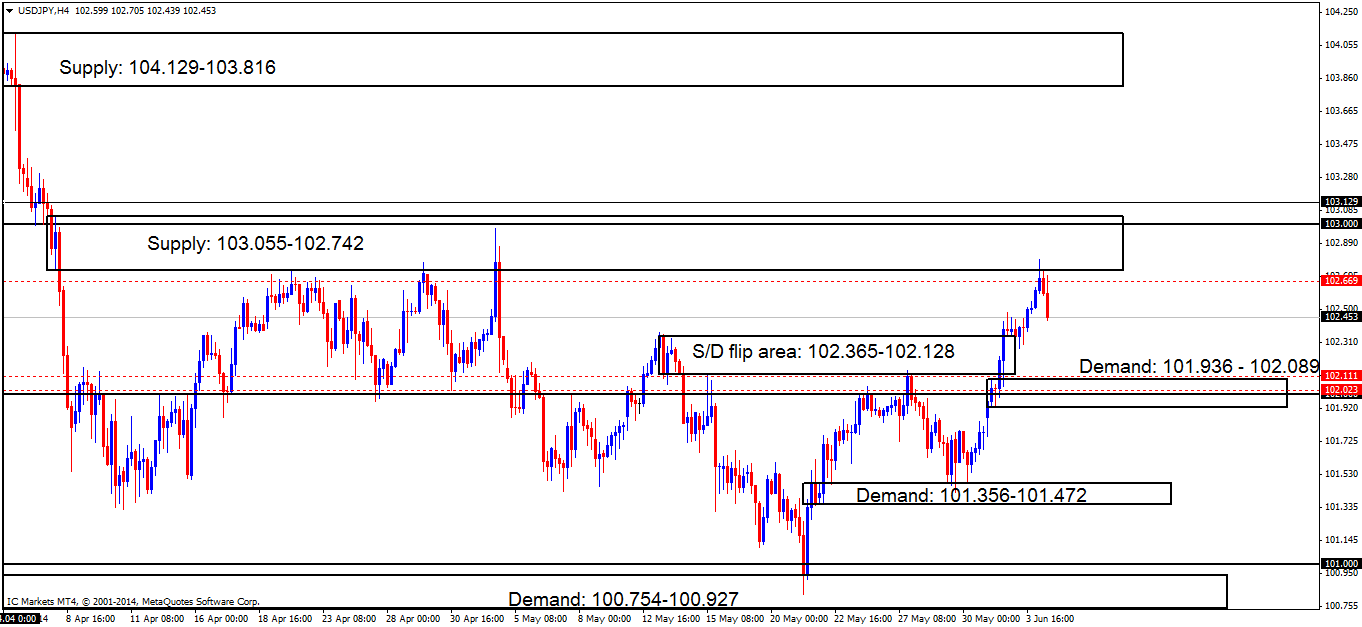
Below is the daily timeframe showing what the bigger picture looks like, the buyers really did take charge recently, but have hit minor resistance at 102.595. If price were to consume the sellers here, this would open a beautiful-looking price void up until supply at 102.114 – 103.812
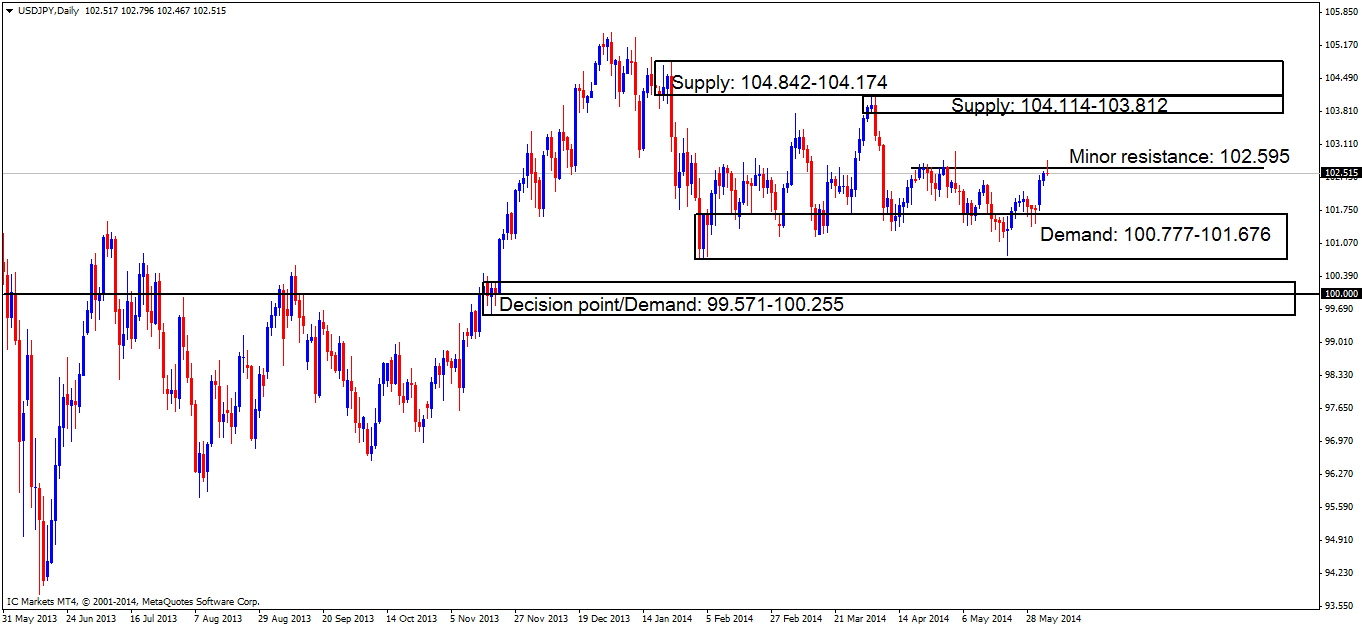
The buyers on the 4hr timeframe (shown below) had recently taken control rallying straight through the price void (room for profit) to supply at 103.055 – 102.472, where a reaction is currently taking place.
The 4hr chart also shows how neatly price reacted off of supply at 103.055 – 102.472, which is expected to at least reach the demand area below at 101.936 – 102.089. Do bear in mind though, we are still currently reacting off of weekly support at 101.254, so any sudden bullish surge should be noted down and expected.
- Buy orders (marked with dashed red lines) are seen at 102.111 and also at 102.023, incorporated in and around demand at 101.936 – 102.089.which is where price will likely head to next after a reaction has already been seen at supply (levels above).
- The sell orders at 102.699 have been executed and at the time of writing, are in a nice profit possibly heading down to demand below at 101.936 – 102.089.
- Areas to watch for buy orders: 102.111 (SL: 101.899 TP: [At the time of writing] 102.699) 102.023 (SL: 101.899 TP: [At the time of writing] 102.699).
- Areas to watch for sell orders (Active) 102.699 (SL: 103.088 TP: [At the time of writing] [1] 102.111 [2] 101.511).
- Most likely scenario: Price has currently reacted off of supply at 103.055 – 102.472 and will likely now head south towards demand at 1-1.936 – 102.089.
EUR/GBP:
Weekly/Daily/4hr TFs.
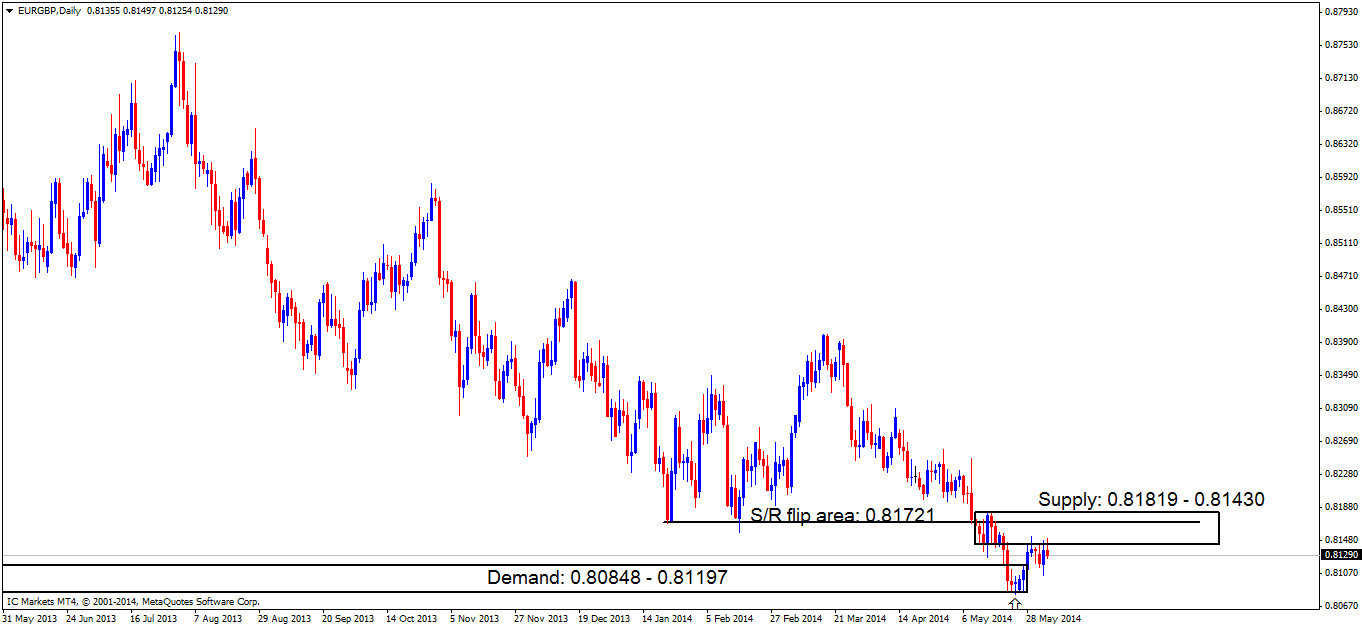
Whilst the weekly timeframe is in demand (shown on the chart 1 below) at 0.80848 – 0.81668, the daily timeframe (chart 2) is showing price struggling at supply (0.81819 – 0.81430), we are beginning to see a conflict in signals here.
Chart 1:

Chart 2:
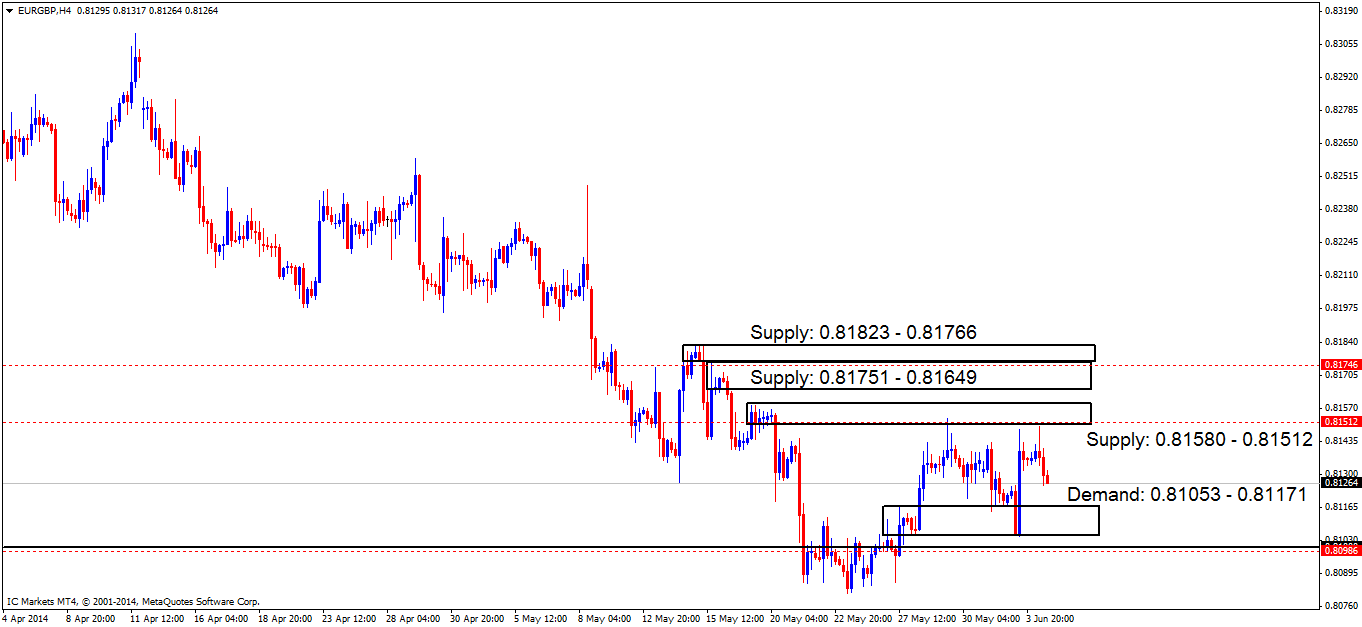
On the 4hr timeframe (shown on the chart below), price still remains capped between demand at 0.81053 – 0.81171 and supply at 0.81580 – 0.81512. Theoretically, we should see higher prices with the weekly timeframe demand taking precedence over the daily supply (levels above).
- New buy orders (marked with red-dashed lines) are now seen below demand (0.81053 – 0.81171) and below the round number 0.81000 at 0.80986. Because the analysis above is saying higher prices are to be expected, pro money will require liquidity for this, so a spike south below demand and below the round number (levels above) to 0.80986 seems logical, this will likely stop out a lot of buyers handing over lots of sell orders for pro money to buy into.
- It is unbelievable, look how close price came to filling the sell orders orders (marked with red-dashed lines) at 0.81512! If the sell order is eventually triggered, and price hits the stop, the break of this supply would possibly see a rally up to the highest of the 3 stacked supply areas at 0.81823 – 0.81766, as price usually tests the extreme zones when areas are stacked similar to this. Impending sell orders will be set just below the supply area just mentioned at 0.81746.
- Areas to watch for buy orders: 0.80988 (SL: 0.80799 TP: [1] 0.81512 [2] 0.81746).
- Areas to watch for sell orders: 0.81512 (SL: 0.81605 TP: 0.81171). Impending orders: 0.81746 (SL: 0.81845 TP: Will be decided depending on approaching price action)
- Most likely scenario: Pro money will likely spike south below demand at 0.81053 – 0.81171, and also below the round number 0.81000 to 0.80986 likely stopping out lots of buyers (creating sell orders) in the process, allowing pro money to buy into these orders for an overall bigger push north, as the higher timeframe is indicating.
USD/CAD:
Daily/4hr TFs.
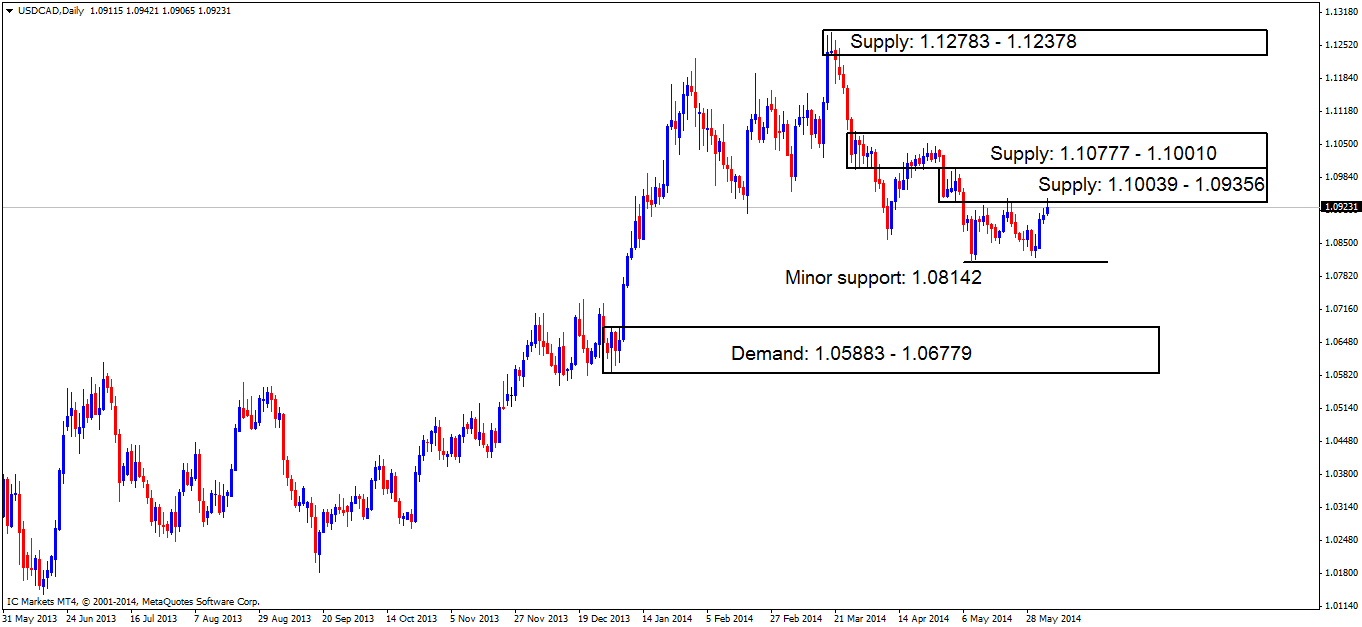
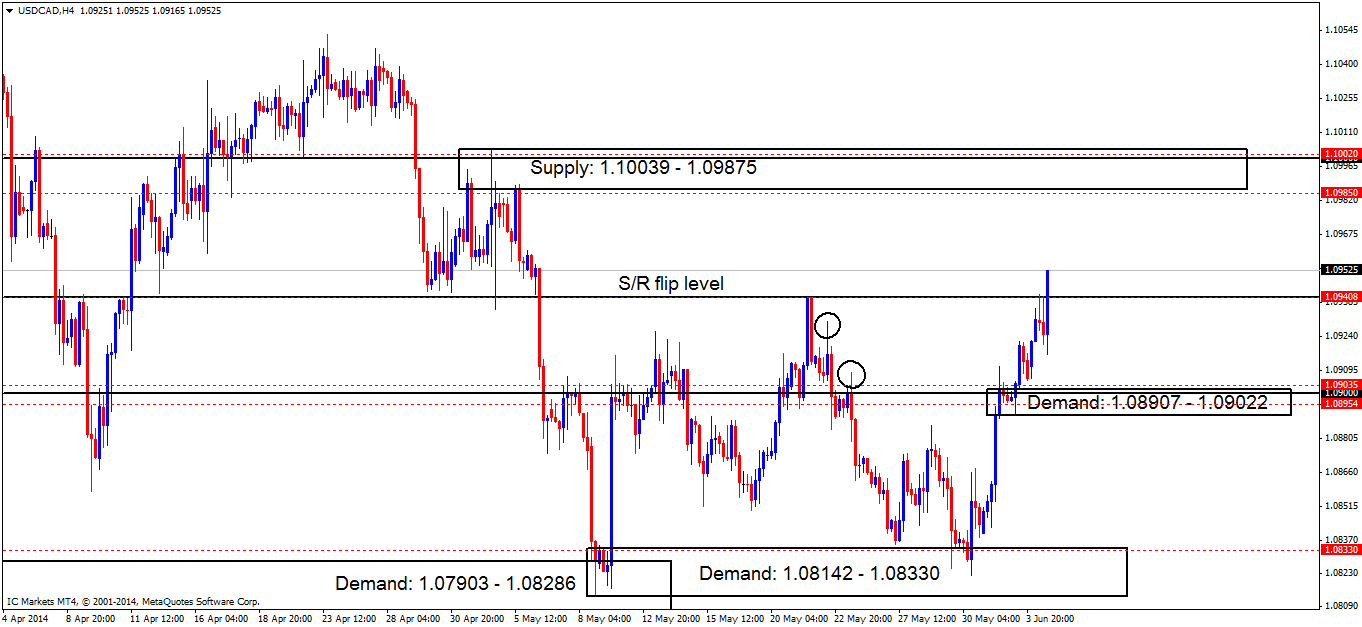
The Daily timeframe is currently trading in the lowest of the two stacked supply areas at 1.10039 – 1.09356 seeing a small bearish reaction.
Price rallied beautifully into the S/R flip level at 0.09408 (seen below on the 4hr chart) and is currently seeing a bearish reaction with two beautiful-looking spikes. It was reported that price may do this in yesterday’s analysis because of the two wicks to the left (circled). These wicks indicated supply consumption, telling us price can rally with little selling pressure.
At the time of writing price is currently capped between the S/R flip level just mentioned above and demand below at 1.08907 – 1.09022.
- Buy orders (marked with a red-dashed line) are currently seen around the newly-formed demand (1.08907 – 1.09022) at 1.09035 and 1.08954 on the expectation a retracement may happen from the daily supply area (levels above).
- The sell orders (marked with a red-dashed line) at the S/R flip level (0.09408) have been executed, if this trade is stopped out new sell orders are seen above, in and around supply at 1.10039 – 1.09875, The nearest being seen just under supply at 1.09850, the next seen just above the round number (1.10000) at 1.10020 as pro money absolutely love to spike these big figure levels to stop traders giving them easy liquidity.
- Areas to watch for buy orders: Impending orders: 1.08330 (SL: 1.08114 TP: Dependent on approaching price action) 1.09035 (SL: 1.08886 TP: 1.09408)1.08954 (SL: 1.08886 TP: 1.09408).
- Areas to watch for sell orders: (Active) 1.09408 (SL: 1.09564 TP: 1.09035). Impending orders: 1.09850 (SL: 1.10063 TP: Dependent on approaching price action nearer the time) 1.10020 (SL: 1.10063 TP: Dependent on approaching price action nearer the time).
- Most likely scenario: Price will likely see a drop in value today due to price currently trading in daily supply at 1.10039 – 1.09356, but do not discount the possibility of a push north before this happens. If the drop is seen today, price will likely visit demand at 1.08907 – 1.09022.
USD/CHF:
Daily/4hr TFs.
The daily timeframe is currently seen trading in supply at 0.90381 – 0.89392 (below).
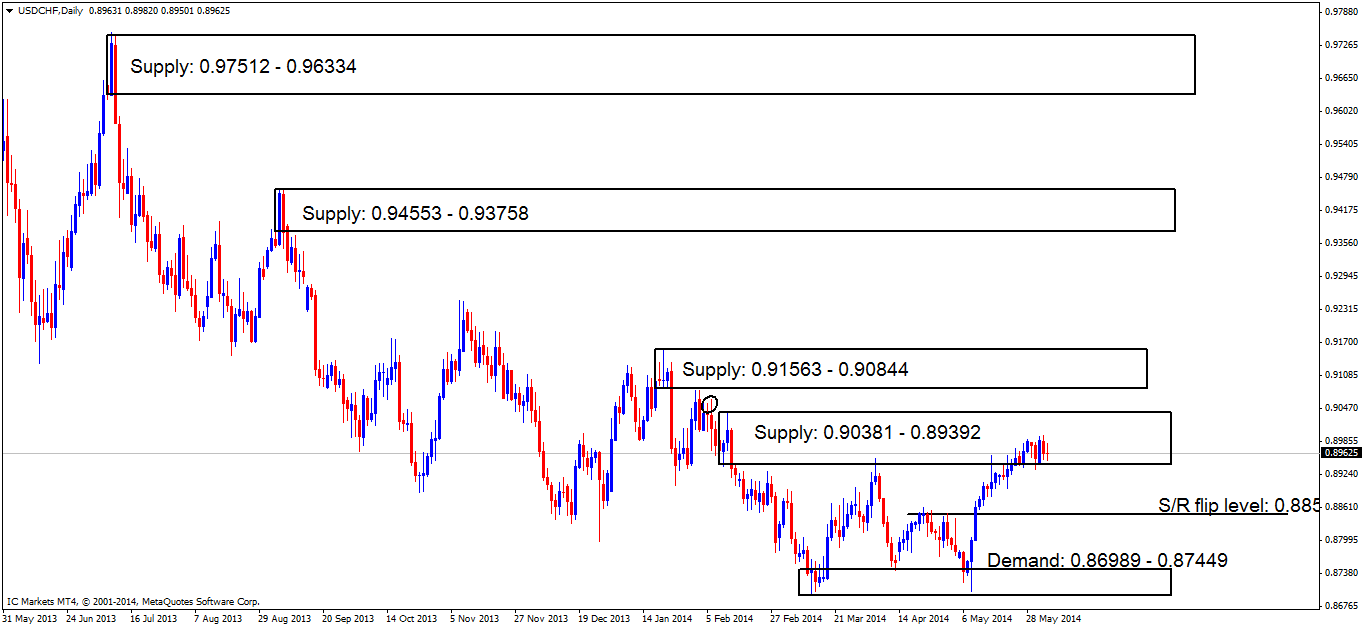
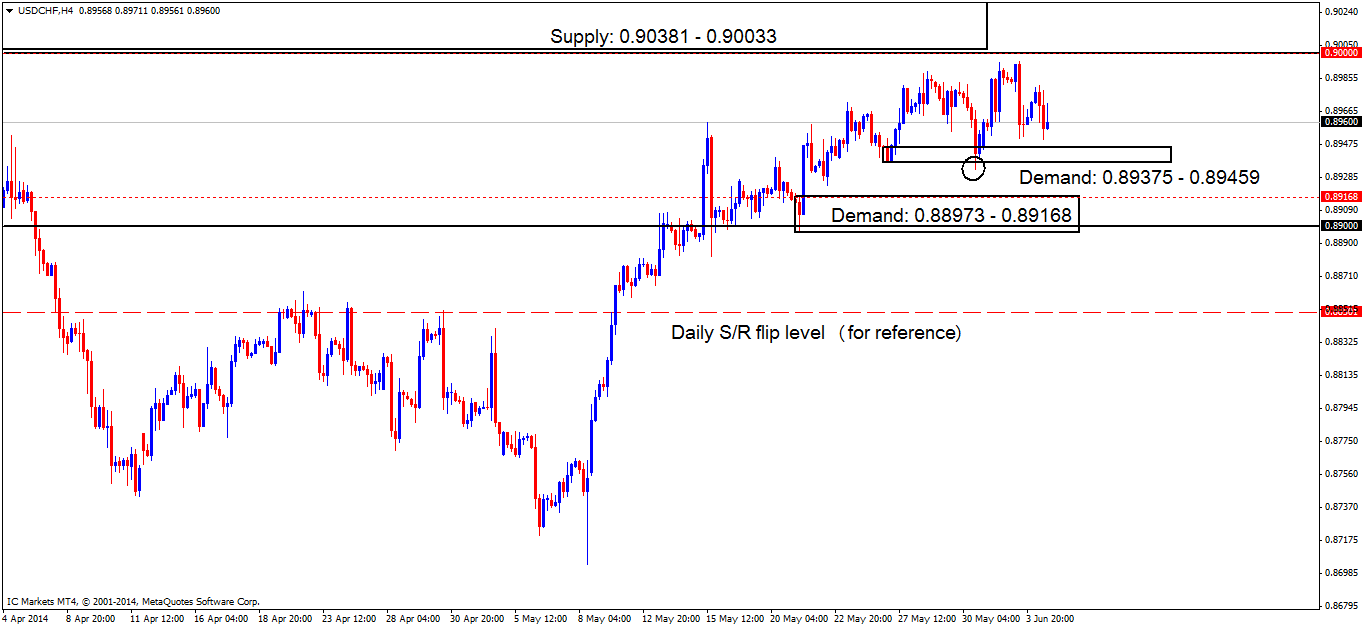
The 4hr timeframe has not seen any developments since the last analysis, this pair is becoming very frustrating to trade at the moment, however, it is worth remembering the circled tail that consumed demand at 0.89375 – 0.89459 is a very important signal indicating lower prices may be seen to at least the next demand (0.88973 – 0.89168) below.
- Buy orders (marked with a red-dashed line) remain the same as the last analysis with orders seen below at 0.89168 around the base of demand (0.88973 – 0.89168)
- Sell orders also remain the same being seen at the big figure level 0.90000, as pro money may spike this level north to collect seller’ stops (buy orders) along with breakout buyers orders to sell into for the overall likely push south.
- Areas to watch for buy orders: 0.89168 (SL: 0.88942 TP: (Overall) 0.90000, but subject to change depending on price action).
- Areas to watch for sell orders: 0.90000 (SL: 0.90398 TP: 0.89168).
- Most likely scenario: Price will likely retrace north from where price is currently trading at the time of writing, up to the round number 0.90000 area to collect liquidity for a possible drop in price.
XAU/USD (GOLD)
Daily/4hr TFs.
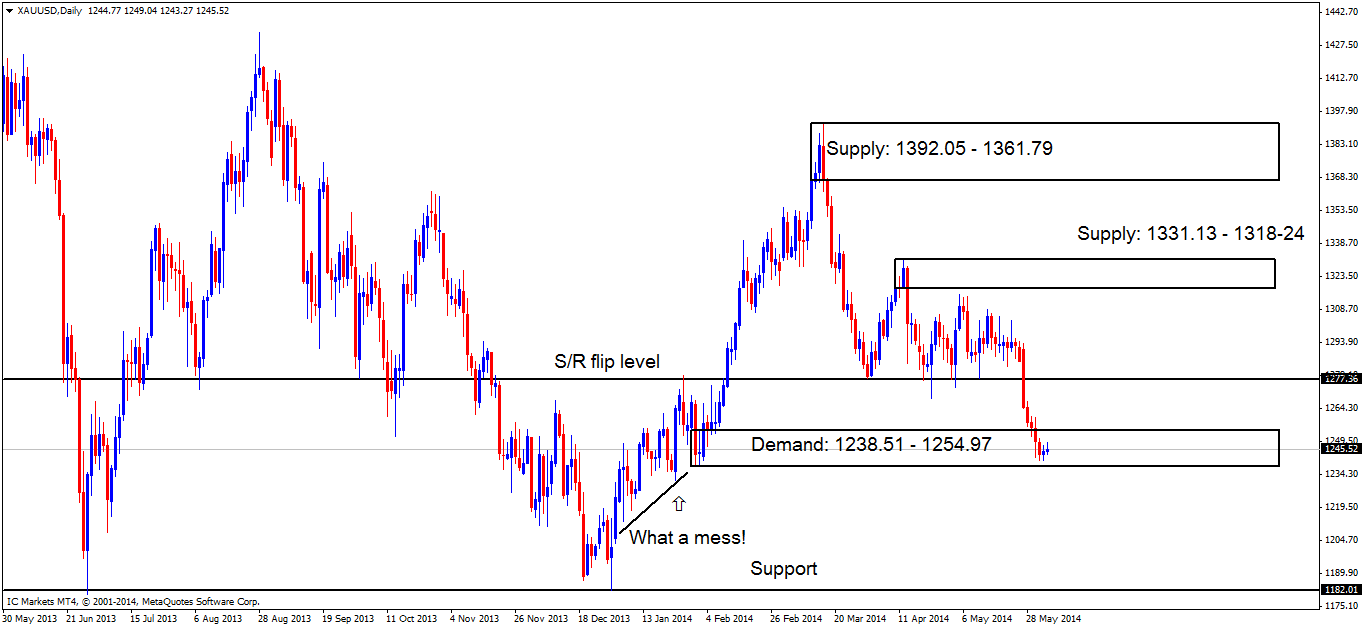
The daily chart shows price is still trading within a great-looking demand area at 1238.51 – 1254.97.
The 4hr timeframe shows stagnant price action, exhibiting no development whatsoever in the recent days trading.
Near-term supply is seen at 1268.03 – 1260.87 with near-term demand being seen below at 1231.56 – 1237.57 which is just beneath daily demand at 1238.51 – 1254.97.
- Buy orders (marked with a red-dashed line) are seen around demand (1231.56 – 1237.57) just below where price is currently ranging at 1237.57. Price may spike below this ranging price action to stop out any lower-timeframe buyers playing the limits of this range, gaining the much-needed liquidity (sell stops) to buy into.
- Sell orders (marked with a red-dashed line) remain the same (marked with a red-dashed line) around supply (1268.03 – 1260.87) at 1260.87.
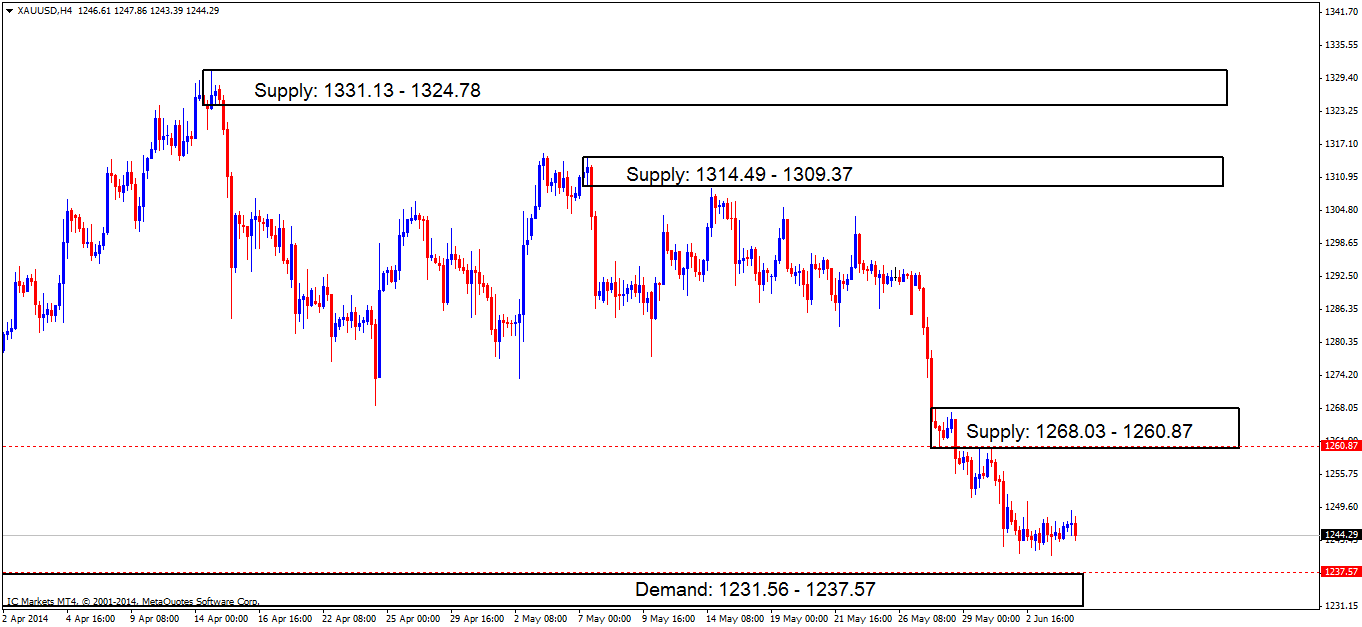
- Areas to watch for buy orders: 1237.57 (SL: 1230.48 TP: 1260.87).
- Areas to watch for sell orders: 1260.87 (SL: 1268.99 TP: 1237.57).
- Most likely scenario: Price will likely spike below demand at 1236.56 – 1237.57, possibly pushing prices higher from there.
Source: ICMarkets


