
Previous Story
Spotting Pivots in Gold Prices
Gold is hard to predict. Often, when it seems to be gearing up to a bearish momentum, it stops and flips. It also often looks highly bullish only to melt down and carry the bulls with it. Of course, this kind of uncertainty is an inherent part of trading, especially when it comes to gold. This means you have to invest more effort in spotting the possible breakouts and pivots that enable us to plan our trades. In this article, we will focus on how derivatives can help you discover accurate pivots in gold prices.
Gold Prices Through Derivatives
The real problem with gold is that it can fall or rise quickly, without warning. That makes it hard to spot opportunities for those who trade it as though it’s a forex pair. However, those out-of-the-blue rapid movements are, in many cases, closely tied to the derivatives market, where most of the gold trade takes place just like any other commodity. In one of my previous articles about implied volatility, I demonstrated how derivatives can help you monitor volatility relatively easily. But what about pivots? You guessed it: derivatives – or, more specifically, option prices on the CME – could be rather handy in that respect, too. How? By showing us at what price most bets are concentrated.
Using Option Analytics on Gold
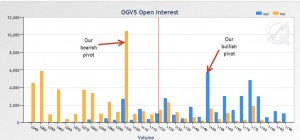
Below the CME Option Analytics illustrates the puts (short) and calls (long) options open on gold at any price. The orange columns are puts, and the blue ones are calls – in other words, sellers versus buyers. The vertical red line in the middle is the current price. Now, what does this mean and how the hell can it help us spot pivots? Very simple. All the orange columns (puts) on the left of the red line (current price) are short bets waiting for the price to fall, while all the blue columns (calls) are long bets waiting for the price to fall.
As can be seen on the 1,100 price, the short bets are overwhelmingly higher than the long bets. This leads to a rather straightforward conclusion: if the price of gold crosses below the 1,100 level, it will immediately trigger a pile of short options and trigger a strong bearish wave, marking a very important pivot we should watch from. If you are long on gold, a break below 1,100 might be a sign to bail out, while if you are a short seller, you might want to wait for gold to cross below 1,100 for bearish momentum to accelerate.
Of course, this is a mirror of what might happen on the right side of our price, where at 1,150 there are piles of call options waiting for gold to rise above. As you can see, this is way lower than the pile of puts below 1,100 but it’s still significant and makes our upper pivot.
On the left side of the red line (options below our current price), if the number of call options was much higher than the puts – lots of bullish bets at 1,100 – it would pin down 1,100 as a strong support zone. Of course, once again dynamics on the left side (above current price) would be the mirror of this. This so-called screen is essentially the CME order book – just like when you look at your own account on the buy and sell orders, this illustrates the buy and sell options of the entire CME exchange on gold and for us. This means we can see where the broader market places its bets and sees pivots, and plan our next gold trade much better.
The post Spotting Pivots in Gold Prices appeared first on MetaTrader Expert Advisor.
Source:: Spotting Pivots in Gold Prices


