
Previous Story
Technical analysis for Gold for March 19, 2019
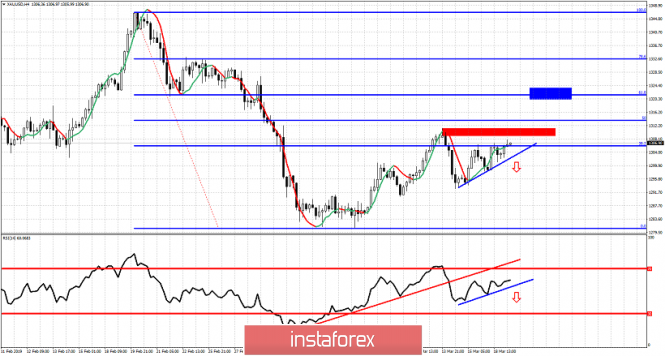
Gold price so far has held support at $1,292 and has also recaptured $1,300. As long as price is above $1,300-$1,292 support area we could see a move higher towards $1,322 and the next Fibonacci target.
Red rectangle – short-term resistance
Blue rectangle – target if red rectangle is broken
Blue lines – support trend lines
Red line – support trend line (broken)
Gold price continues to trade above $1,300 and as Dollar is weakening we could see another try to move towards $1,320 or higher. The 61.8% Fibonacci retracement is a possible target as long as price and the RSI hold above their blue support trend lines. Resistance is found at $1,312 and if broken we have confirmation we are heading towards $1,322. So far price respects support and bulls remain in control of the short-term trend. Bears need to break at least below $1,300 in order to hope for more downside.
The material has been provided by InstaForex Company – www.instaforex.com


