
Previous Story
Technical analysis of USD/CHF for September 12, 2017
Posted On 12 Sep 2017
Comment: 0
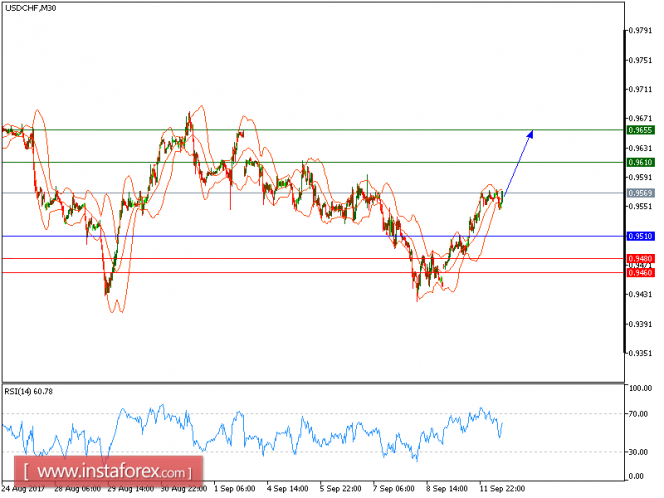
USD/CHF is expected to continue the upside movement. The pair is supported by a bullish trend line since September 8, which confirms a positive outlook. The upward momentum is further reinforced by both rising 20-period and 50-period moving averages. The relative strength index is bullish and calls for another advance.
U.S. stocks and dollar rose, while US Treasury bonds slipped as fears concerning Hurricane Irma and North Korea eased.
To sum up, while the price holds above 0.9510, look for a new rise to 0.9610 and even to 0.9655 in extension.
Chart Explanation: The black line shows the pivot point. The present price above the pivot point indicates a bullish position, and the price below the pivot points indicates a short position. The red lines show the support levels and the green line indicates the resistance levels. These levels can be used to enter and exit trades.
Strategy: BUY, Stop Loss: 0.9510, Take Profit: 0.9610
Resistance levels: 0.9610, 0.9655, and 0.9700
Support levels: 0.9480, 0.9460, and 0.9415
The material has been provided by InstaForex Company – www.instaforex.com
Source:: Technical analysis of USD/CHF for September 12, 2017


