
Previous Story
Technical analysis of USDX for March 23, 2017
Posted On 23 Mar 2017
Comment: 0
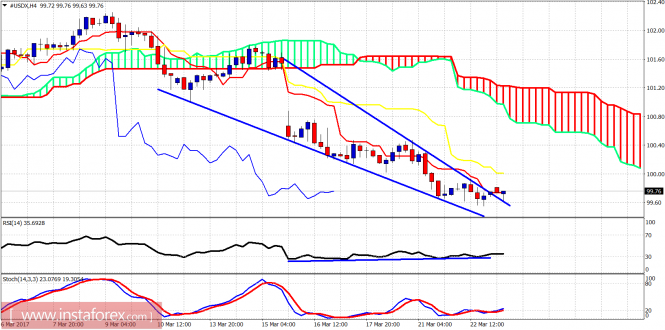
The Dollar index has most probably bottomed and is reversing to the upside. The Dollar index has broken out of the downward sloping wedge and a bounce towards 100-101 is expected over the next two trading sessions.
Blue lines – wedge
Short-term support is at 99.25 and at 99.60. Resistance is at 100 and the next is at 100.80-101.There are also bullish divergence signals in the 4-hour chart. This strengthens the scenario of a strong bounce from the current levels.
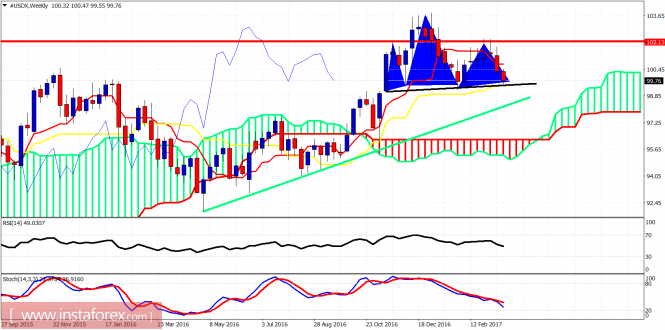
Red line – resistance
Black line – neckline support
Green line – long-term support trend line.
The Dollar index as expected has reached very close to the Head and Shoulders neckline support at 99.25. The price is showing reversal signs. A bounce from current levels will find resistance at 101. Key resistance for the longer-term bullish trend is at 102.30. Support is critical at 99.25. If it is broken, I expect the Dollar index to test the long-term support green trend line.
The material has been provided by InstaForex Company – www.instaforex.com


