
Previous Story
Thursday 18th December: Daily technical outlook and review.
Posted On 18 Dec 2014
Comment: 0
EUR/USD:
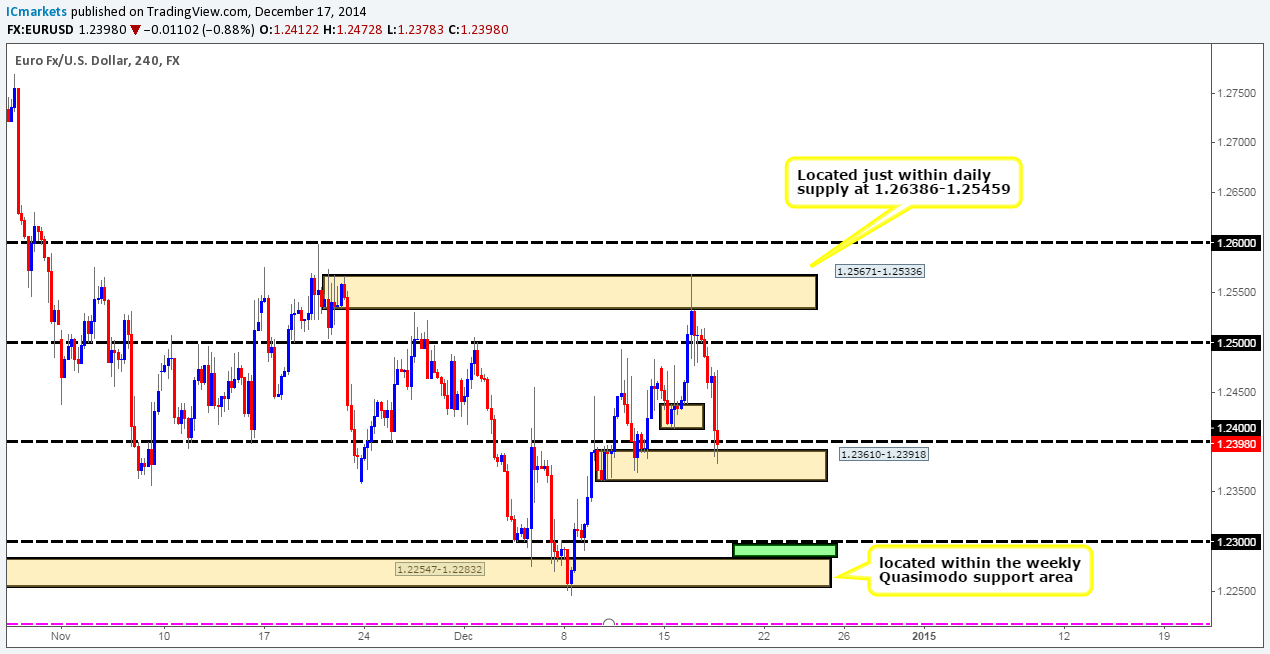
Weekly Timeframe: The weekly timeframe shows that the sellers continue to drive prices south after coming within a few pips of hitting a major weekly swap level at 1.25816. Assuming that the sellers remain ambitious here, we may see a further decline down towards a weekly Quasimodo support area coming in at 1.22403-1.22942.
Daily Timeframe: A bearish reaction was seen at around daily supply at 1.26386-1.25459 (Encapsulates the aforementioned major weekly swap level) on Tuesday. The EUR/USD continued to fall, but at the time of writing found the 1.23783 low to be supportive enough to allow the buyers back in to play. It will be interesting to see what the 4hr timeframe looks like.
4hr Timeframe: For anyone who read our last report on the Euro, you may recall us mentioning that we would be interested in shorting the retest of 1.25 if a close below this level was seen. A close lower did indeed happen, but unfortunately with no retest. The downward momentum caused price to consume a 4hr demand area at 1.24134-1.24380, and pierced through 1.24 into a partially consumed 4hr demand area coming in at 1.23610-1.23918, where at which point buying interest came into the market.
Where do we see the market moving to today? Well, assuming that the current 4hr demand area is taken out, which it likely will be considering where price is located on the higher-timeframe picture (see above), we can very likely expect a further decline in value down towards 1.23, which sits just above the aforementioned weekly Quasimodo support area. Buying the Euro within the green area (1.23/1.22547-1.22832) with lower-timeframe confirmation is something we would be interested in doing if price reaches that far.
Current buy/sell levels:
- Buy orders: Watching for buying opportunities between 1.23/1.22547-1.22832 (Predicative stop-loss orders seen at: dependent on where one confirms this level).
- Sell orders: Flat (Predicative stop-loss orders seen at: N/A).
GBP/USD:
Weekly Timeframe: Just when we thought a breakout above the weekly swap level at 1.57166 was going to be seen, the sellers make an appearance and steal the show. The recent downward momentum has pushed the market back down to where it came from – a weekly demand area seen at 1.54260-1.56110. Let’s take a look to see what the lower-timeframe picture looks like.
Daily Timeframe: The recent sell off on the GBP has consequently seen price test test a daily demand area seen at 1.54260-1.55378 (located relatively deep within the aforementioned weekly demand area).
4hr Timeframe: The 4hr timeframe shows that the sellers took no prisoners. 1.57 was consumed after a little pressure from the buyers, and then price completely obliterated 1.56 forcing the market down to a 4hr demand area at 1.55402-1.55627 (located just above the aforementioned daily demand area).
From here, if price closes above 1.56, this could then create enough upside momentum to test 1.57. The buying interest should not really come as any surprise since we know that the pound is currently trading around noteworthy demand on the higher timeframes at the moment (see above). Keeping in mind the recent volatility surrounding this pair, being patient is probably the way we have to go until calmer waters are seen.
Current buy/sell levels:
- Buy orders: Flat (Predicative stop-loss orders seen at: N/A).
- Sell orders: Flat (Predicative stop-loss orders seen at: N/A).
AUD/USD:
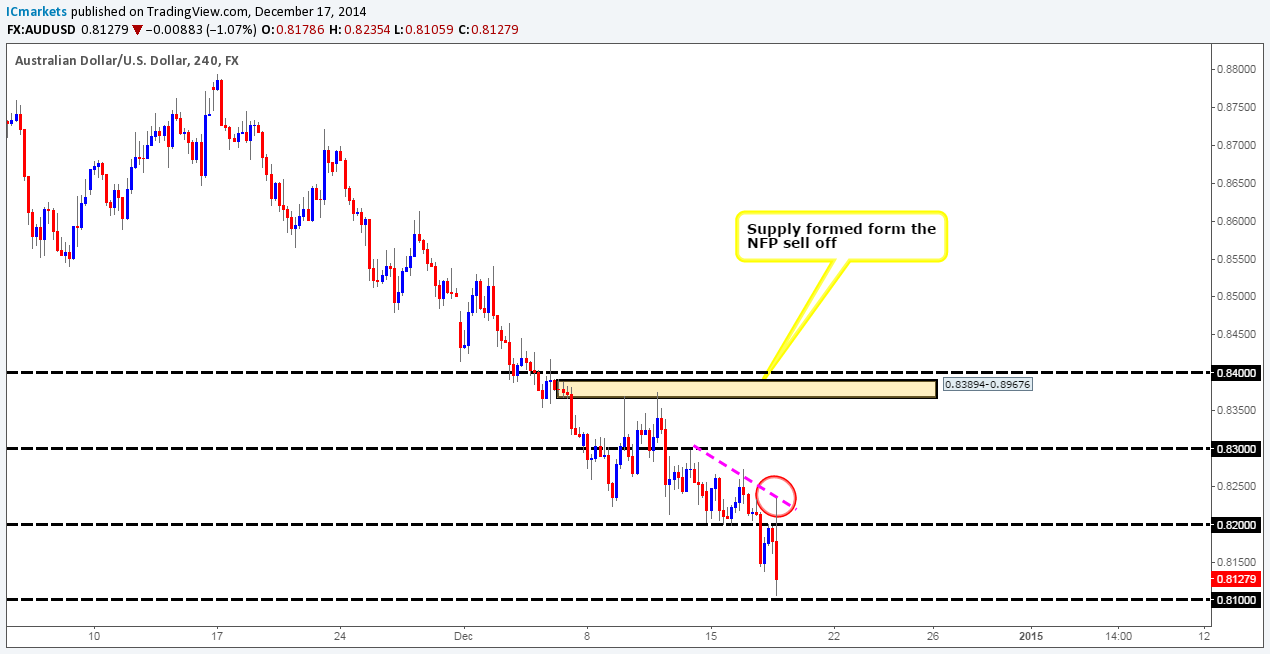
Weekly Timeframe: The USD continues to hammer the AUD deeper into the major weekly demand area seen at 0.80646-0.84601. A break below this area may promote further selling down towards a weekly demand area coming in at 0.76999-0.79740.
Daily Timeframe: The daily timeframe currently shows that price is trading deep within a daily demand area at 0.80809-0.82270 (located deep within the weekly demand area mentioned above at 0.80646-0.84601). A break below here would likely clear the path south down towards a daily Quasimodo support area seen at 0.76999-0.78349 (located deep within the weekly demand area mentioned above at 0.76999-0.79740).
4hr Timeframe: In our last report, we mentioned that if price closed below 0.82, we would be looking to short a confirmed retest down to 0.81. As we can all see, a close lower was indeed seen; we however missed the opportunity to sell at around 3pm GMT time yesterday on the inverted pin-bar candle. Taking this trade would have likely caused a loss for us, as the market only offered 20 pips or so, before it turned north. Following a short up burst of buying, price then aggressively sold off to our target area – 0.81.
We know from the higher timeframe analysis that the overall bias for the Aussie is south at the moment. The only way in which we would consider buying this pair now would be if price were to break above the high circled in red at 0.82354, as the path north would then likely be clear up to at least 0.83. The reason being is simply because we believe there to be consumed supply to the left marked with a pink trend line – check out the supply consumption wicks at: 0.82354/0.82734. That being said though, there may be a chance to enter long around the 0.81 area, if one sees exceedingly good confirmation on the lower timeframes. However, this trade should only be considered a bounce/scalp until proven otherwise.
Current buy/sell levels:
- Buy orders: Watching the lower-timeframes for confirmed long entries around 0.81 (Predicative stop-loss orders seen at: Dependent on where one confirms the level).
- Sell orders: Flat (Predicative stop-loss orders seen at: N/A).
USD/JPY:
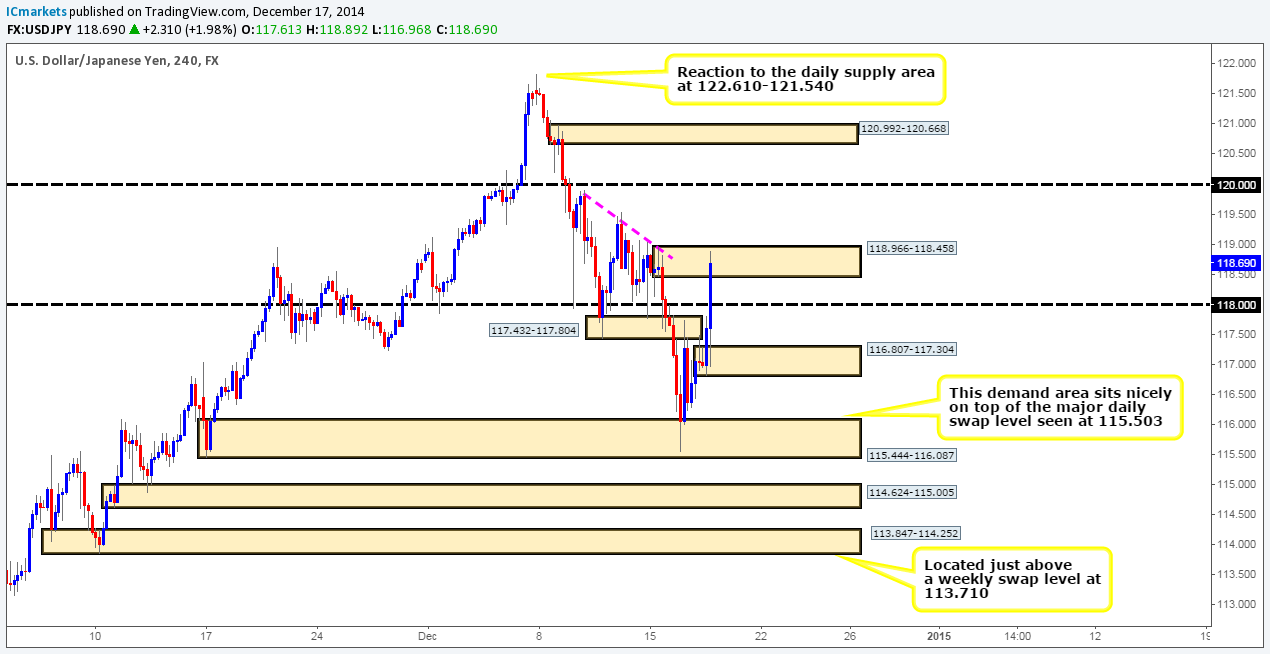
Weekly Timeframe: The weekly timeframe shows that price is currently standing strong on a major weekly swap level at 115.503. In the event that further buying is seen from here, a test of a weekly Quasimodo resistance level at 122.180 may be seen.
Daily Timeframe: The daily timeframe on the hand reveals that for prices to continue rallying north, selling opposition will need to be consumed within a daily supply area coming in at 119.196-118.041. Assuming that the sellers are indeed consumed here, a move higher will likely follow towards a daily supply area at 122.610-121.540 (encapsulates the aforementioned weekly Quasimodo resistance level).
4hr Timeframe: A breakout north above a small 4hr swap zone seen at 117.432-117.804 recently took place, and forced the market above 118 into a 4hr supply area at 118.966-118.458.
Trading short from here is not something we would be comfortable doing for two reasons:
- Price is trading off of a major weekly swap level at the moment (see above).
- Risk/reward considerations argue entering short with prices so close to potential support at 0.81.
A break above this 4hr supply area would likely clear the path north for prices to challenge at least the huge psychological level 120, and given enough time, the 4hr supply area seen above it at 120.992-120.668. The reason we believe prices could move so high is because of the (possible) consumed supply/sell orders seen to the left marked with a pink trendline, check out the supply consumption wicks seen at 118.966/119.046/119.546.
Current buy/sell levels:
- Buy orders: Flat (Predicative stop-loss orders seen at: N/A).
- Sell orders: Flat (Predicative stop-loss orders seen at: N/A).
USD/CAD:
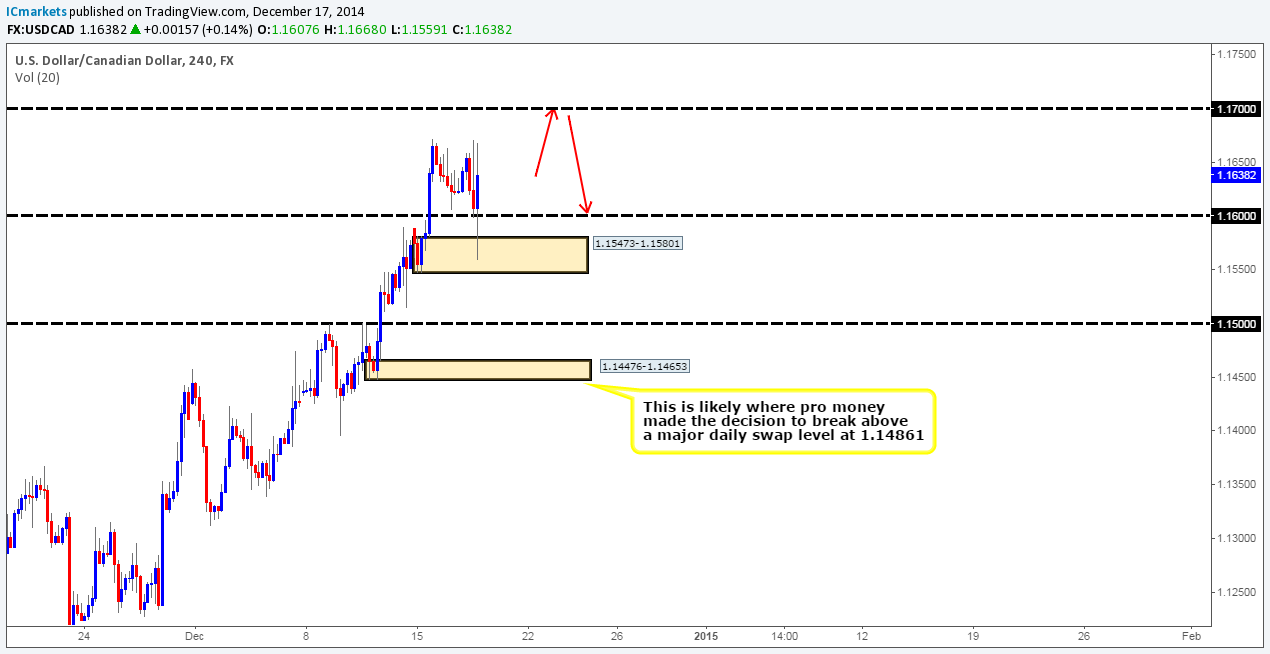
Weekly Timeframe: The weekly timeframe shows that the buyers and sellers are currently battling for position within a weekly supply area seen at 1.17225-1.15417 (surrounded by a larger weekly supply area seen at 1.18061-1.14739). It will be interesting to see what the lower timeframes show.
Daily Timeframe: Further selling was indeed seen from daily supply at 1.17225-1.16182 (located deep within the weekly supply area mentioned above at 1.17225-1.15417). However, the selling momentum was quickly brought to a halt yesterday as interested buyers defended the daily channel support (prior resistance – 1.10807/1.13842).
4hr Timeframe: Regarding the USD/CAD pair, we are not willing buyers and it will likely continue to stay this way until price consumes the aforementioned higher-timeframe supply areas.
Recent developments show that after a little buying interest seen around 1.16, the market broke lower down to a nice-looking 4hr demand area at 1.15473-1.15801, where active buyers were waiting to attack.
Very similar to yesterday’s analysis, we see the following scenario playing out today:
We believe a rally higher will be seen up to 1.17. This may sound unwise considering where price is located on the higher timeframes (see above), but in our experience, the market really likes deep levels of support and resistance within supply and demand areas. Assuming that a rally higher does indeed take place from here, we would be very interested in selling around 1.16960, just below 117 (located deep within both weekly and daily supply – see above). Setting a pending sell order here would be too risky for us; we’d require some sort of confirmation from the lower timeframes before, since round-number levels usually suffer deep tests/spikes. First take-profit target for this trade would be set just above 1.16, as shown by the red arrows.
Current buy/sell levels:
- Buy orders: Flat (Predicative stop-loss orders seen at: N/A).
- Sell orders: 1.16960 [Tentative] (Predicative stop-loss orders seen at: Dependent on where one confirms the level).
DAX 30:
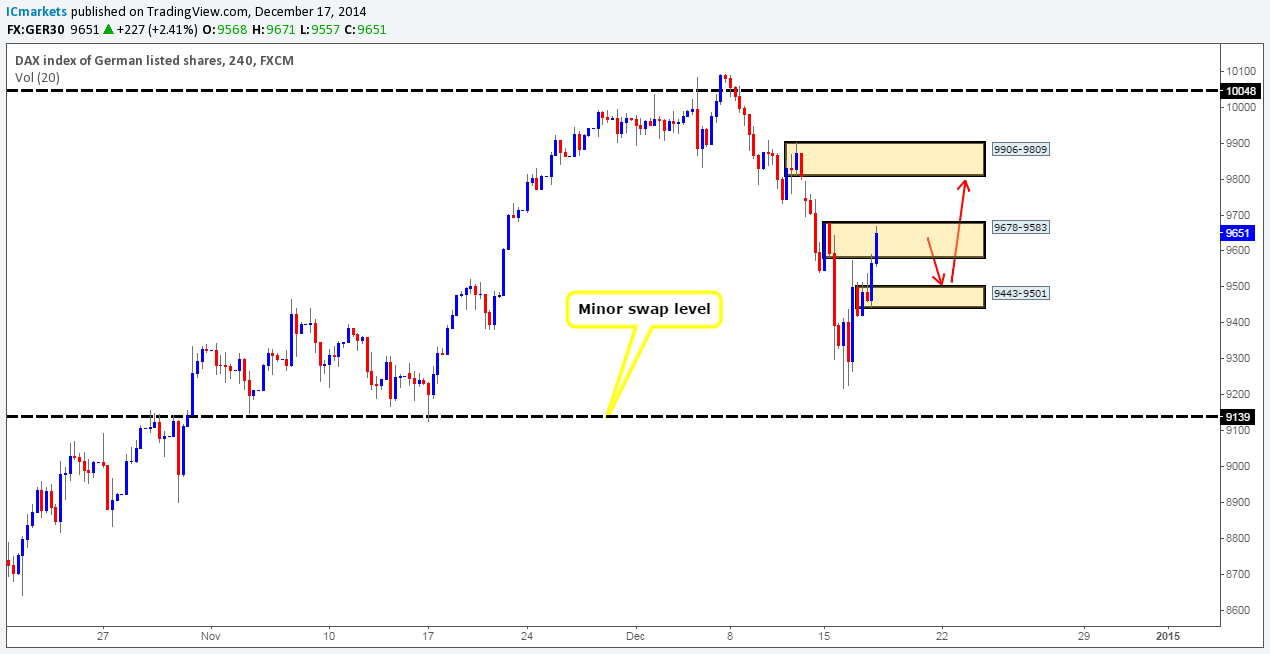
Weekly Timeframe: Active buying is currently being seen on the DAX from a weekly decision-point demand area at 9126-9467. This is clearly proving to be a troublesome barrier for the sellers to overcome.
Daily Timeframe: The daily timeframe shows that the rebound from the daily demand area at 9126-9233 extended higher yesterday closing for the day at 9651. We still feel that the DAX has more gas left yet, and will likely continue to rally until hitting the daily swap level seen at 9790, where at which point we’re expecting active sellers to make an appearance.
4hr Timeframe: The DAX closed deep within a 4hr supply area seen at 9678-9583. Selling here is not something we’d be comfortable doing, since we would effectively be selling into higher-timeframe buyers (see above). This is usually not the best path to take!
In the event that selling is seen today, do not expect much of a decline, the furthest we see the DAX declining to is a small 4hr decision-point demand area at 9443-9501. So much so, that we are going to set a pending buy order just above at 9507 using half of our normal position. The other half will be used when, or indeed if price confirms this area. We only have one target in mind for this trade, and that is at 9799, just below a 4hr supply area coming in at 9906-9809, and is also nicely located a few points above the aforementioned daily swap level.
Current buy/sell levels:
- Buy orders: 9507 (Predicative stop-loss orders seen at: 9412).
- Sell orders: Flat (Predicative stop-loss orders seen at: N/A).
DOW 30:
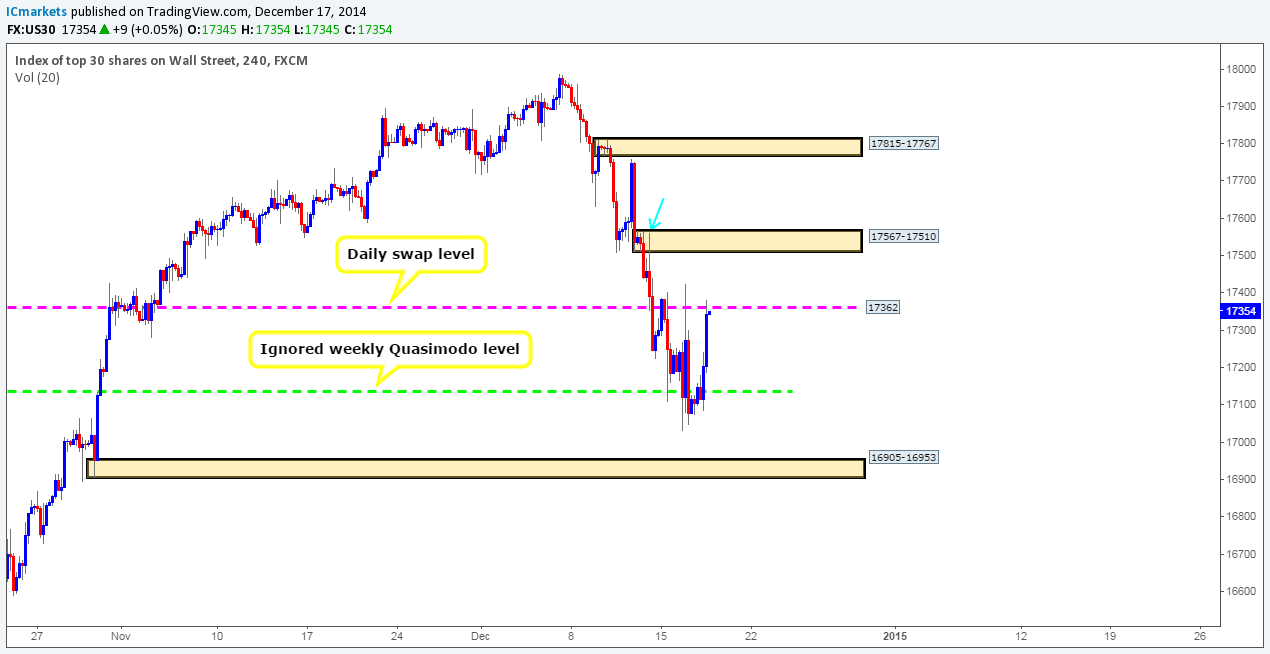
Weekly Timeframe: Buying interest is currently being seen off an ignored weekly Quasimodo resistance level at 17135.
Daily Timeframe: The daily timeframe shows that no further decline was seen yesterday. We were initially expecting price to trade down towards a fresh daily decision-point demand area at 16895-16997 before a move higher to 17362 was seen. In order for us to be convinced that the DOW will continue to rally, price will need to close above 17362, and successfully retest it as support, only then would we consider buying into this index. Let’s take a look at the 4hr-timeframe picture to see if there are any short-term opportunities to take advantage of.
4hr Timeframe: The 4hr timeframe presents a similar picture to that of the daily timeframe. A break above 17362 would likely open the gates for price to challenge a 4hr supply area coming in at 17567-17510. However, we would only consider buying once 17362 has been successfully retested with confirmation as support.
Assuming that a break and retest does indeed happen, we would not only be targeting the aforementioned 4hr supply area, but also the 4hr supply area seen above at 17815-17767. The reason why is simply because we believe the closest of the two supply areas has already likely been weakened from the spike on the 12/12/14 at 17562 seen marked with a blue arrow.
Given the points made above, we are more than happy to sit on the side lines for the time being, but at the same time know that we are ready to pull the trigger if a break and confirmed retest of 17362 is seen.
Current buy/sell levels:
- Buy orders: Flat (Predicative stop-loss orders seen at: N/A).
- Sell orders: Flat (Predicative stop-loss orders seen at: N/A).
XAU/USD (Gold):
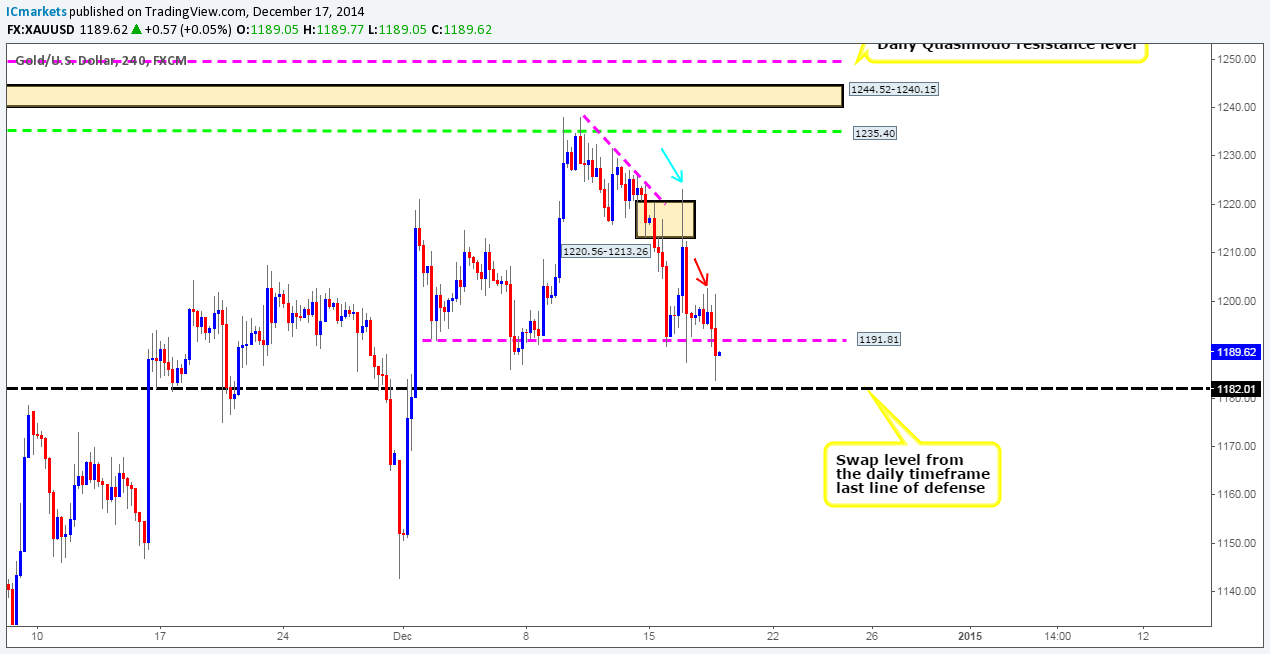
Weekly Timeframe: The weekly supply area seen at 1255.20-1226.18 seems to be proving itself as the sellers are currently seen driving price south. Assuming that the sellers keep up with this enthusiasm, it is likely we may see another test of 1136.30, a weekly decision-point demand level.
Daily Timeframe: The daily timeframe shows that the buyers are struggling to maintain support within the daily decision-point demand area at 1185.97-1203.20. A small spike/tail was seen below here yesterday, consequently hitting a major daily swap level coming in at 1182.01. This in our opinion is the last line of defense against the aforementioned weekly supply area; a daily close below here would expose 1149.42 which in turn could likely fuel further selling. Let’s take a look to see what the 4hr timeframe has to say about this.
4hr Timeframe: Assuming that the buyers can hold out above the daily swap level at 1182.01, and break above the high 1202.81 marked with a red arrow, we will then be confident that higher prices will likely be seen up to at least 1235.40, and begin looking for areas to enter long from.
Why 1235.40? As already mentioned in the previous analysis, the reasoning behind us believing price could move so high is simply because supply has already likely been consumed at 1220.56-1213.26 (blue arrow), and also lurking just above this area of supply, marked with a pink trendline is what we believe to be consumed supply as well. Check out the price behavior, we see this as pro money spiking north to collect unfilled sell orders to continue selling, but what this also does at the same time is clear the path north for future buying – limited sellers = clear path north for the buyers.
It will be interesting to see how Gold will develop in the next 24hrs.
Current buy/sell levels:
- Buy orders: Flat (Predicative stop-loss orders seen at: N/A).
- Sell orders: Flat (Predicative stop-loss orders seen at: N/A).
The post Thursday 18th December: Daily technical outlook and review. appeared first on .
Source:: Thursday 18th December: Daily technical outlook and review.


