
Previous Story
Thursday May 7th: Election Day in the UK today could cause Sterling pairs to swing wildly.
Posted On 07 May 2015
Comment: 0
EUR/USD:
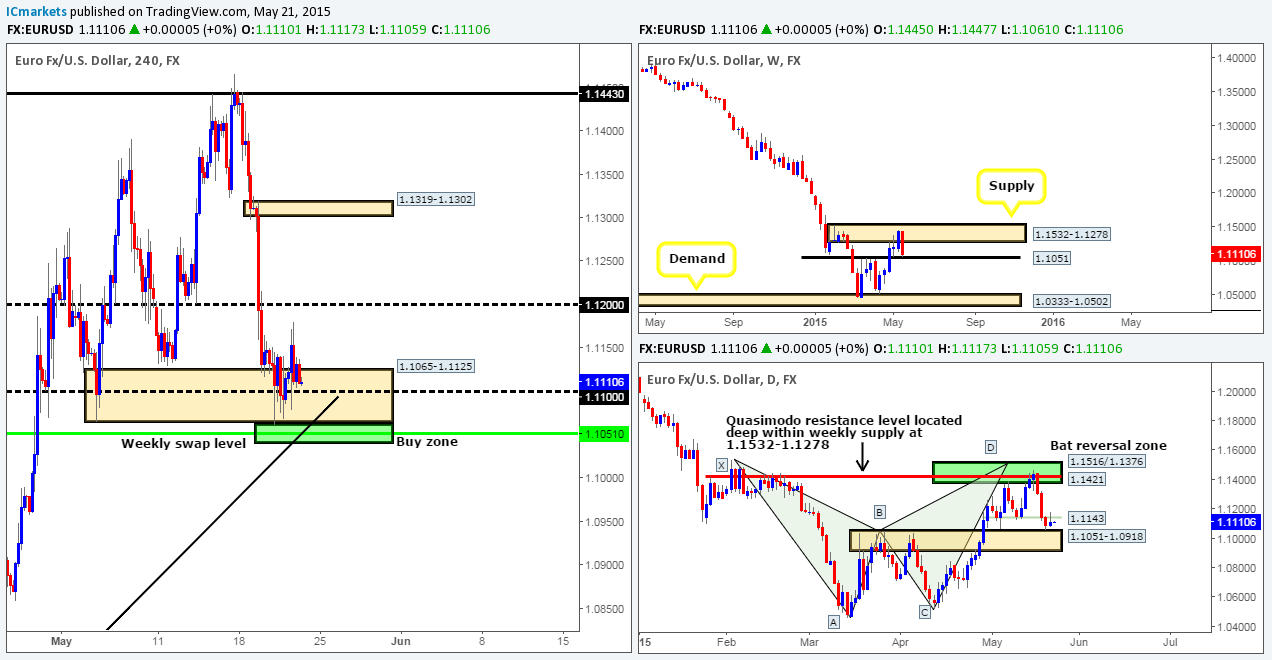
Weekly view: Following the strong retest of the weekly swap level 1.1096, price rallied higher into weekly supply at 1.1449-1.1278. This has been the most we’ve seen the Euro rally since price began its descent back in May 2014. In spite of this, our long-term bias still remains south and will continue to do so until we see a convincing push above the aforementioned weekly supply area.
Daily view: Yesterday’s daily candle shows that the buyers were clearly in the driving seat during yesterday’s session, rallying the Euro a cool 160 pips into the close 1.1346. Consequent to this, price is now trading within a stone’s throw away from the Harmonic resistance zone (Bat pattern) coming in at 1.1516/1.1376.
4hr view: From this angle, we can see that the EUR/USD rallied during most of the London and New York sessions yesterday, consequently taking out 1.1300 and colliding with 4hr supply coming in at 1.1387-1.1346 (located just below the aforementioned daily Harmonic resistance zone).
Considering the markets overall position on the higher-timeframe picture at the moment (see above), our team is naturally swaying more to the short side today… However, selling at the current 4hr supply area would be a risky trade in our book for the simple reason that it’s positioned just below a psychological round number 1.1400 – it has fakeout written all over it! As such, one could either wait to see if prices do fake higher and attack the 1.1400 number today and wait for a lower timeframe confirmation signal to short, or if a fake higher is not seen, wait for prices to convincingly close below the 1.1300 number, since this would likely free the path south for further downside to at least 1.1200. Selling from the current 4hr supply into 1.1300 could put you in drawdown, or worse at a loss – patience is key here!
Our current buy/sell orders:
- Buy orders: Flat (Predicative stop-loss orders seen at: N/A).
- Sell orders: 1.1400 region [Tentative – confirmation required] (Predicative stop-loss orders seen at: dependent on where one confirms this level).
GBP/USD:
Weekly view: Last week’s action saw price clash with a weekly supply area coming in at 1.5551-1.5391, consequently forming a beautiful-looking bearish pin-bar candle in the process.
Daily view: The daily timeframe shows price is now firmly trading within a daily swap area seen at 1.5298-1.5208. A break above this area could see a rally take place up to the daily Quasimodo resistance level 1.5478. Conversely, should the sellers be able to hold out within this zone, this will likely attract further selling in the market which could see prices dropping down to test the daily swap level seen at 1.4975.
4hr view: The Sterling pair broke above and retested the round number 1.5200 during yesterday’s sessions, which, as you can see, appears to be holding strong at the moment. With today being Election Day in the UK and polls showing it to be the closest Election in recent history, anything could happen on this pair – literally expected the unexpected!
During times when volatility is expected to be high, we tend to focus only on daily timeframe levels when trading the 4hr charts. The highs circled in red coming in around 1.5500, which coincide nicely with the aforementioned daily Quasimodo resistance line is an area to keep an eye on today. In addition to this, we can also see that the daily swap level 1.4975 lines up nicely with the 4hr demand area at 1.4958-1.5000 making this also a zone to watch.
Trading any of the above extremes will, for us at least, require corresponding support from the lower timeframes before we risk capital.
Our current buy/sell orders:
- Buy orders: 1.4958-1.5000 [Tentative – confirmation required] (Predicative stop-loss orders seen at: 1.4952).
- Sell orders: 1.5500 area [Tentative – confirmation required] (Predicative stop-loss orders seen at: dependent on where one confirms this area).
AUD/USD:
Weekly view: Following the pin-bar rebound seen from the weekly swap level 0.8064 last week, little follow-through selling has taken place. In the event that this buying continues, and a sustained move above 0.8064 is seen, this pair could potentially trade all the way back up to 0.8500 region.
Daily view: From this angle, we can see that price has recently seen a reaction from a daily supply area coming in at 0.8074-0.8006, which is positioned just below the weekly swap level mentioned above at 0.8064. Provided that the sellers can hold the market lower here, we may see a drop in value back down to test the 0.7875/0.7822 daily swap area.
4hr view: The AUD/USD pair, as you can see, closed above the mid-level number 0.7950 during Asia, once Europe opened for business, a retest of this number was seen which saw prices rally up to the psychological threshold 0.8000. It was only when the New York session got under way did we see any selling take place.
Price is currently trading at 0.7971. The Asian session will likely see a small sell off, testing the mid-level number 0.7950, or even the 4hr demand area located just below it at 0.7917-0.7940. Whether the European traders will trade long from this 4hr demand zone is very difficult to tell since let’s not forget that price is currently located around overall resistance on the higher timeframes at the moment (see above).
With everything taken into consideration, we have set alerts at 0.7945, just above the aforementioned 4hr demand area, and just below 0.8000 at 0.7990. Once an alert is triggered, we’ll zoom down to the lower timeframes and take a look at how price action is behaving, if there’s strength being seen, we may consider an intraday position at either of the levels mentioned above.

Our current buy/sell orders:
- Buy orders: 0.7945 [Tentative – confirmation required] (Predicative stop-loss orders seen at: dependent on where one confirms this level).
- Sell orders: 0.7990 [Tentative – confirmation required] (Predicative stop-loss orders seen at: dependent on where one confirms this level).
USD/JPY:
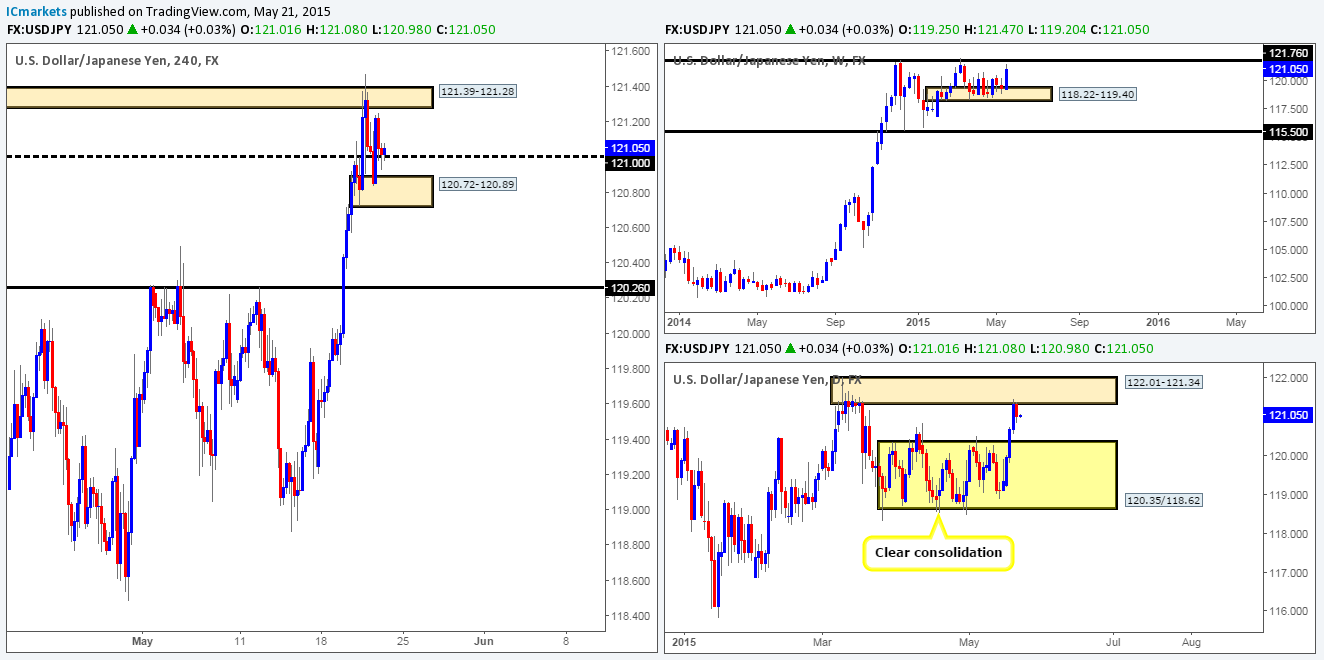
Weekly view: For the past month and a half, the buyers and sellers have been seen battling for position within a weekly demand area coming in at 118.22-119.40. Our long-term bias will remain north on this pair as long as price continues to trade above the weekly swap level seen below this area at 115.50.
Daily view: From this angle, it appears the USD/JPY pair has begun chiseling out a consolidation zone between daily support seen at 118.62 (located deep within the aforementioned weekly demand area), and a daily Quasimodo resistance level coming in at 120.35. Recent action shows that the rebound seen from the upper limits of this range (120.35) extended lower during yesterday’s session. In the event that the sellers can continue with this tempo today, it’s likely we’ll see prices challenge the ascending daily trendline extended from the low 115.55.
4hr view: The recent descent on this pair took out both the 4hr demand area at 119.60-119.74, and the mid-level number 119.50. As of now, we can see that price is retesting 119.50 as resistance. Providing that the sellers remain strong here, we could potentially see a sell off today down towards the 119.00 handle. Our rationale behind this idea comes from recent price behavior. Check out the swing low seen marked with a black arrow at 119.19, this spike stabbed through the low 119.25, likely consuming most of the buyers and trapping a ton of breakout sellers. This – coupled with the fact that the daily scale is showing room for prices to continue south could be a sign that prices want to test the 119.00 number today.
As we can see, price has already reacted from the 119.50 region; it’s now up to us to find a suitable setup on the lower timeframes to confirm this level, stop-loss placement for this trade will be dependent on where one confirms this level, good luck.
Our current buy/sell orders:
- Buy orders: Flat (Predicative stop-loss orders seen at: N/A).
- Sell orders: 119.50 area [Tentative – confirmation required] (Predicative stop-loss orders seen at: dependent on where one confirms this level).
USD/CAD:
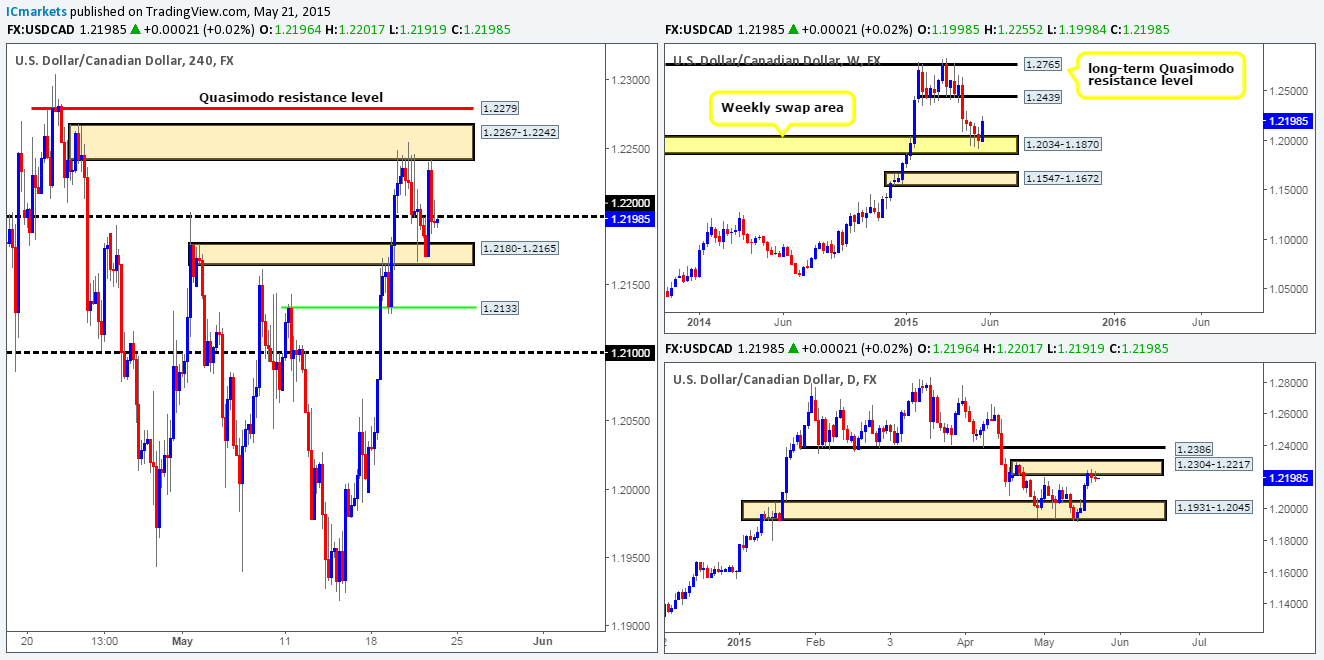
Weekly view: From this angle, we can see price is once again trading below the weekly swap area 1.2265-1.2092. A close below this zone would likely confirm that further downside may ensue towards the weekly swap level 1.1814.
Daily view: The daily timeframe on the other hand, shows that in order for further selling to take place on the weekly timeframe, the daily demand area at 1.1931-1.2045 which converges so beautifully with Harmonic Bat support (completing at 1.1921) will need to be taken out.
4hr view: The USD/CAD pair sold off amid yesterday’s sessions, which as you can see, saw price viciously spike below the round number 1.2000 into a 4hr demand area seen at 1.1931-1.1960 (located deep within the aforementioned daily demand area). The rebound seen from this 4hr demand zone clearly attracted further buying as price closed back above the 1.2000 number.
Price is currently trading at 1.2035. Shorting the 4hr supply area at 1.2086-1.2066 just above here could be a possibility today. However, here are some things to consider… The round number 1.2100 seen just above it will likely be a magnet for price, thus a fake above this 4hr supply zone may take place. Furthermore, shorting this zone will see you cross swords with daily buyers from within daily demand at 1.1931-1.2045, so waiting for lower timeframe selling strength to form would, in our opinion, be the best path to take at this area.
1.2000 is also a level we have on our watch list today. Like the 4hr supply zone we just discussed above, this level will also require confirming price action. Round numbers, as you can see in history, tend to fakeout, therefore it’s always best to wait for this to happen before jumping in the market.
Our current buy/sell orders:
- Buy orders: 1.2000 [Tentative – confirmation required] (Predicative stop-loss orders seen at: dependent on where one confirms this area).
- Sell orders: 1.2086-1.2066 [Tentative – confirmation required] (Predicative stop-loss orders seen at: 1.2091).
USD/CHF:
Weekly view: The weekly timeframe shows that price has now broken below the weekly demand area seen at 0.9170-0.9343. Assuming that this break is genuine and not a fakeout for higher prices, the path south looks ‘support free’ down until the 0.9018 weekly swap level.
Daily view: From the daily timeframe, we can see that price spiked below daily demand at 0.9155-0.9206 (located deep within weekly demand at 0.9170-0.9343), potentially opening the gates for further downside towards daily demand seen at 0.8933-0.9045 (encapsulates the aforementioned weekly swap level).
4hr view: For those read our previous reports on this pair, you may recall us mentioning on numerous occasions that should price clear demand around the 0.9300 hurdle, it’s likely we’re going to see a sell off down to 0.9165, which as you can see, took place yesterday. Unfortunately though, we were not a part of this move since price never retested the 4hr supply area seen at 0.9331-0.9295, it reacted to the low 0.9276 formed on the 1st May.
With all of the above taken on board, 0.9165 is a key level to watch today. On the condition that the sellers remain strong below this number, there could potentially be a shorting opportunity (with lower timeframe confirmation) down towards 4hr demand at 0.8984-0.9068 (located within daily demand at 0.9155-0.9206). On the flip side, if prices close above 0.9165 today and holds firm against round number resistance 0.9200, it’s likely we’re going to see a break above 0.9200 going into Friday.

Our current buy/sell orders:
- Buy orders: Flat (Predicative stop-loss orders seen at: N/A).
- Sell orders: 0.9165 [Tentative – confirmation required] (Predicative stop-loss orders seen at: dependent on where one confirms this level).
US 30:
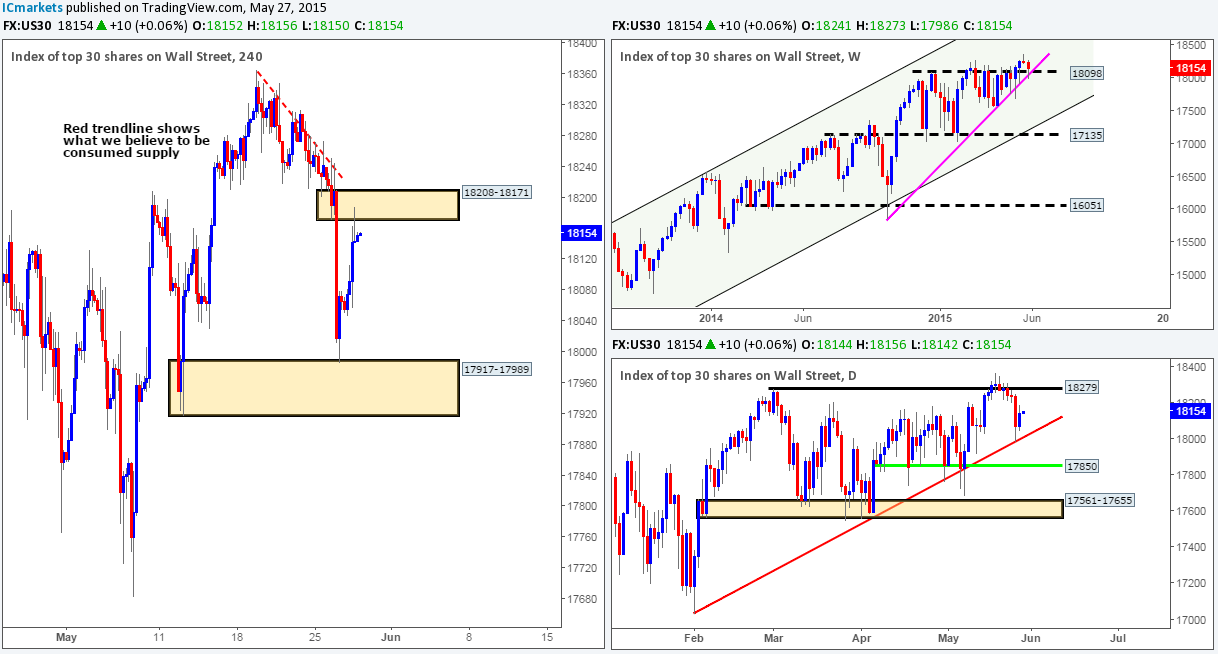
Weekly view: Although the overall trend has been strong since early 2009, a temporary ‘ceiling’ to this index has formed around the 18098 region which has remained strong for an impressive four months!
Daily view: From the daily picture, we can that the daily trendline extended from the low 17033 failed to hold the market higher yesterday. Is this break a sign that price wants to test daily demand at 17561-17655? Let’s take a look at what the 4hr timeframe has to say about this…
4hr view: (As mentioned in the previous analysis, the DOW has been forming what we believe to be a long-term 4hr bullish pennant formation – upper 4hr trendline extends from the high18279, while the lower 4hr line has been taken from the low 17556).
The 4hr timeframe shows that the DOW aggressively sold off once London opened for business. This move saw price aggressively attack the lower limits of the 4hr pennant formation, but, as you can probably see, was unable to close below its converging 4hr support level 17817. Under normal circumstances, we would be looking to buy from this area using the 5/15 minute timeframes to judge our entry, but seeing as price has just closed below a daily trendline (see above); this could turn out to be a risky move. Therefore, considering the extra risk at this area, we’re going to step up a level and use only the hourly timeframe for confirmation. If price action can take out hourly supply coming in at 17903-17892, then our team would consider trading long on any retracement into a supportive structure..
Our current buy/sell orders:
- Buy orders: 17817 region [Tentative – confirmation required] (Predicative stop-loss orders seen at: dependent on where one confirms this area).
- Sell orders: Flat (Predicative stop-loss orders seen at: N/A).
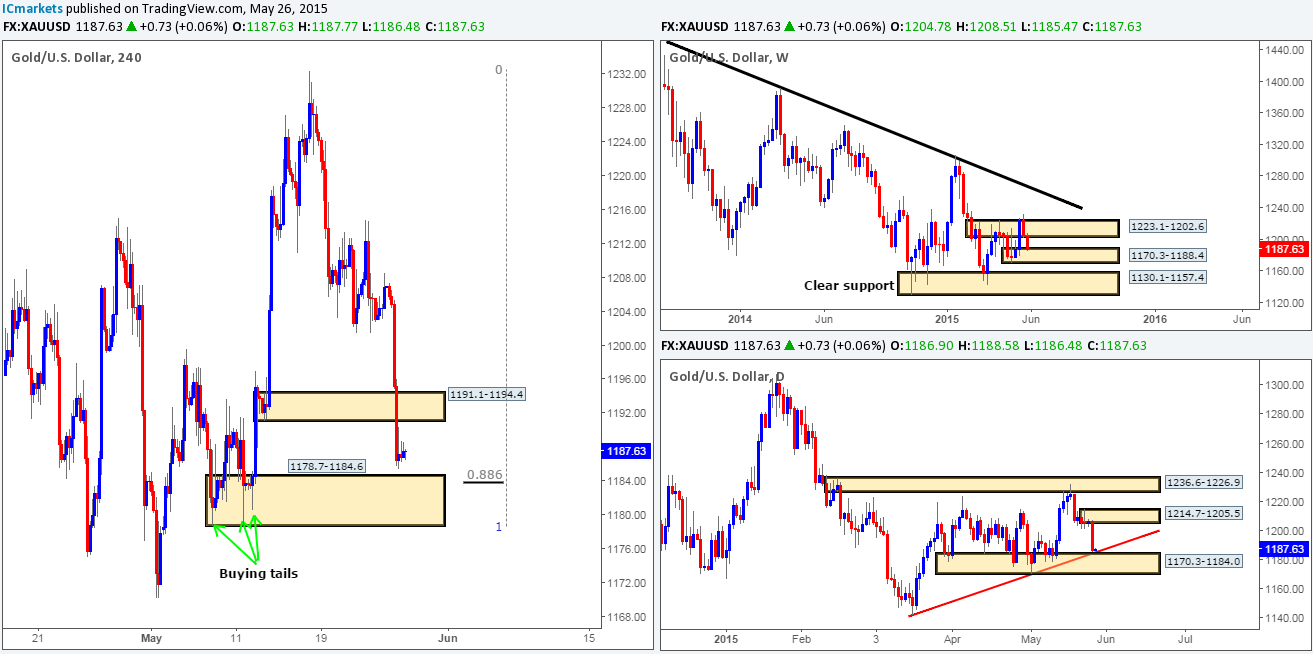
XAU/USD (Gold)
Weekly view: From a weekly standpoint, the trend on Gold is still firmly south, and will remain that way in our opinion until price closes above the weekly trendline extended from the high 1488.0. Current price action, however, shows that the sellers appear to be struggling to hold this market below the weekly supply area at 1223.1-1202.6. A sustained move above this supply zone would likely attract further buying towards the aforementioned weekly trendline.
Daily view: The view from here shows that price is currently trading in no-man’s-land between daily supply at 1215.0-1204.5 (located within the aforementioned weekly supply area), and a daily demand area coming in at 1159.4-1170.8 (located just within the weekly demand area seen at 1130.1-1168.6).
4hr view: Yesterday’s sessions saw the 1192.7 4hr support tore to pieces. This likely stopped out countless traders trying to buy and sell from this level on the lower timeframes! In spite of this, price appears to be holding nicely now under this level. We’ve took a quick look on the 15 minute timeframe (our usual timeframe for lower timeframe entries) and found price has taken out potential 15 minute demand seen at 1190.0-1190.4. Assuming that price sees a retracement and hits 15 minute supply coming in at 1192.6-1192.2, we’ll enter short at 1192.1 with a stop placed above this zone at 1193.20. First take-profit target will be dependent on how price approaches this zone – traders who are also considering taking this trade are advised to constantly monitor this position since we have very little confluence from the higher timeframes on this trade.
Our current buy/sell orders:
- Buy orders: Flat (Predicative stop-loss orders seen at: N/A).
- Sell orders: 1192.1 (Predicative stop-loss orders seen at: 1193.20).
The post Thursday May 7th: Election Day in the UK today could cause Sterling pairs to swing wildly. appeared first on .
Source:: Thursday May 7th: Election Day in the UK today could cause Sterling pairs to swing wildly.


