Is It Time For A GBPUSD Retreat or Will It Be New 4 Year Highs? Charts Show Critical Point.
Posted On 24 Apr 2014
Comment: 0
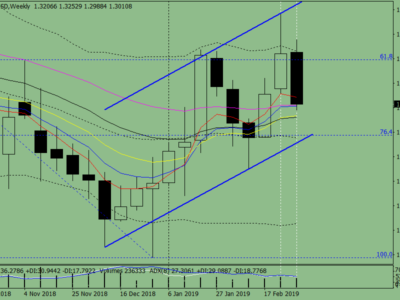
The Pound has been in a strong up trend since June last year and is now approaching it’s 4 year point of reckoning, the critical price point of 1.6877, high from 15 November 2009 as seen in the weekly chart below.
This is the third time price has reached this point on the weekly after being in a massive 2000+ pip range for the past 5 years.
GBPUSD Weekly on 24 April 2014 (click to enlarge)

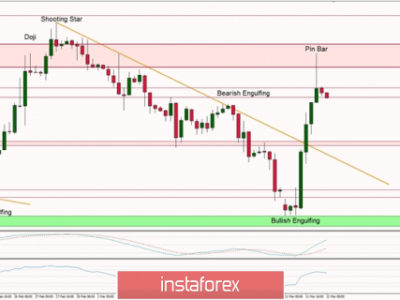
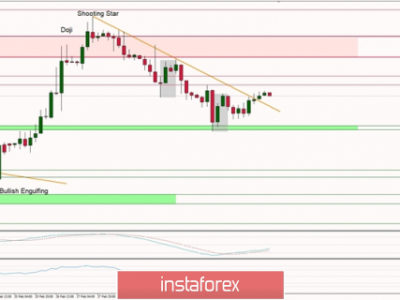
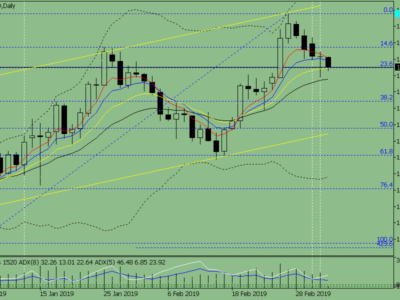
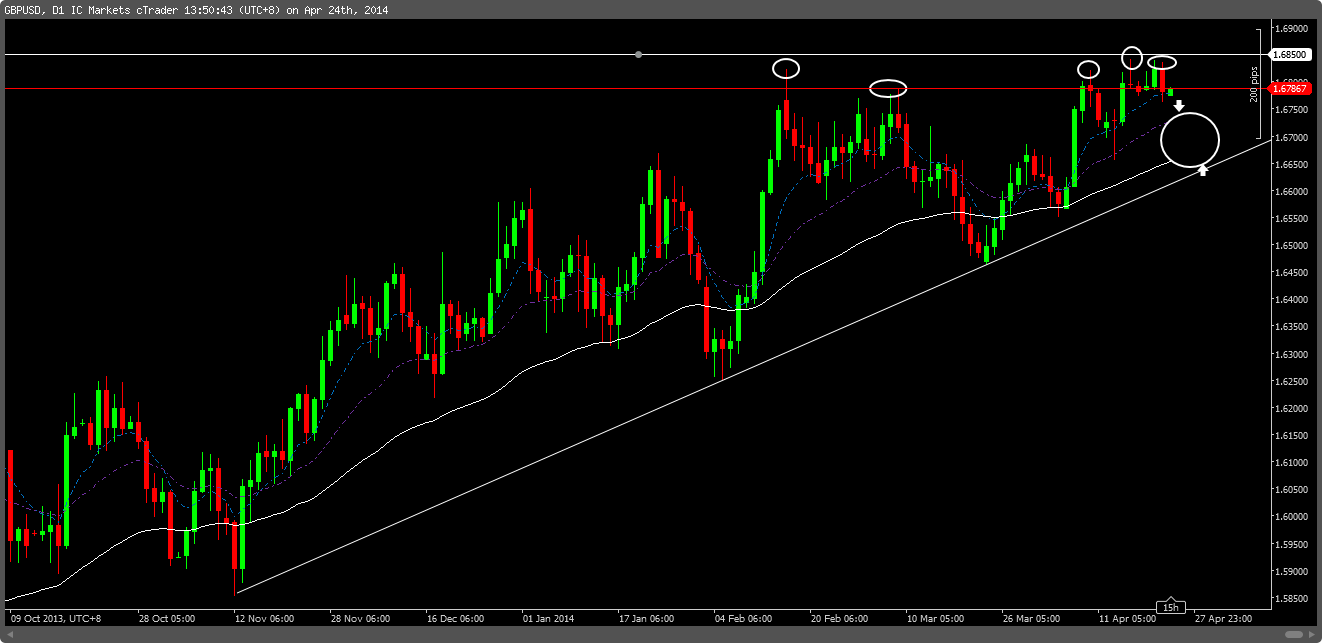
The daily chart below shows strong price reaction as it approaches the critical level. We have had 5 reactions around the 1.6850 area (25 pips short of the ultimate high). There seems to be a lot of distribution happening at this level as traders begin profit taking and potentially putting themselves in a short position for a immediate short-term drive back down to support. Support to the downside is the trend-line that has been respected since November last year.
There certainly seems to be enough virgin ground to the downside to allow for a short-term retrace before a potential resumption of the up-trend and eventual break of the highs. Yesterdays strong bear close might be enough to suggest a short trade but when trading against the trend Ideally I would like to see some stronger price action however this is the 5th time price has reacted at this point.
GBPUSD Daily on 24 April 2014 (click to enlarge)
What are you thoughts on GBPUSD? Is it going to break or retrace? Let us know in the comments section at the bottom of this page.
Is It Time For A GBPUSD Retreat or Will It Be New 4 Year Highs? Charts Show Critical Point. http://t.co/2Ry3AWXijC
— Forex Alchemy (@forexalchemy) April 24, 2014