
Previous Story
Indicator analysis. Daily review on GBP/USD for May 4, 2020
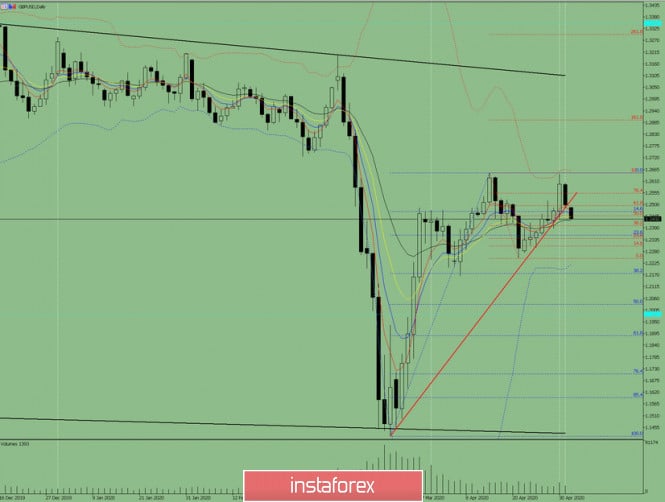
Trend analysis (Fig. 1).
Today, a continuation of the downward trend is possible from the level of 1.2499 (closing of Friday candle) with the target of 1.2357 – a 23.6% retracement level (presented in a blue dotted line). In case of breaking this level downwards, the downward movement may continue with the target of 1.2177 – a 38.2% retracement level (presented in a blue dashed line).
Fig. 1 (daily chart).
Comprehensive analysis:
– Indicator analysis – down;
– Fibonacci levels – down;
– Volumes – down;
– Candlestick analysis – down;
– Trend analysis – up;
– Bollinger Lines – up;
– Weekly schedule – down.
General conclusion:
Today, the price may continue to move downward with the target of 1.2357 – a 23.6% retracement level (presented in a blue dotted line).
Another possible scenario is a bullish trend from the level of 1.2357 – a 23.6% retracement level (presented in a blue dashed line) with the target at the resistance line 1.2522 (presented in a red bold line). In case of breaking this level upwards, the continuation of the upward movement is possible with the target at the upper fractal 1.2643 (presented in a blue dashed line).
The material has been provided by InstaForex Company – www.instaforex.com
Source:: Indicator analysis. Daily review on GBP / USD for May 4, 2020


