Previous Story
Bullish trend reversal triggered in Canadian dollar
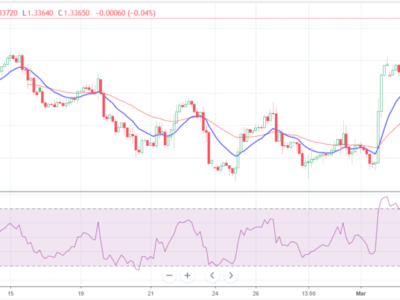
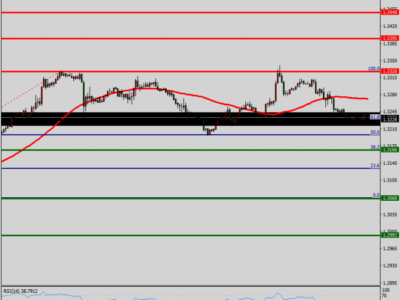
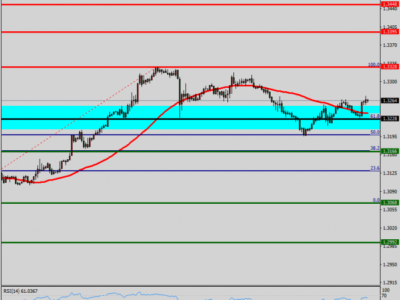
Last week the USD/CAD currency pair triggered a bullish trend reversal as it rose above the prior week’s high and closed above it on a weekly basis. That’s the first time in 13 weeks that the pair closed above the prior week’s high. At the same time the 14-period Relative Strength Index (RSI) turned up from its most oversold position since October 2007 and crossed above the 30 line. Further, a double bottom breakout was triggered on the 4-hour chart (see below). This bullish price behavior follows support hit two weeks ago at 1.2412. That’s within the area of support from early-May 2016.

The rally follows a steady 12-week decline off the 1.3795 peak. That peak completed a 61.8 per cent retracement of the prior decline coming down from the January 2016 high, and marked the high of a 12-month ascending trend channel. A breakdown of the trend channel occurred six weeks ago with a drop below the uptrend line at the lower portion of the channel that was confirmed by a drop below the two week low at 1.3163.
Although the larger pattern is looking bearish, as we have a lower swing high from May and the breakdown of the ascending channel could be the first signal for a continuation of a developing downtrend, the odds now favor a tradeable rally off the recent low.

Potential targets based on previous price structure can be seen in the enclosed 4-hour chart above. The initial double bottom could hold and lead to higher prices or a larger bottoming pattern may develop. Either way, given how price historically behaves (support becomes resistance, and resistance becomes support) we should see a move back towards the uptrend line at the bottom of the channel as it’s tested as resistance.
Summary
- USD/CAD looks to have found intermediate-term support at 1.2412 two weeks ago.
- Bullish trend reversal confirmed last week on weekly close above prior week’s high. First time this has happened in 13 weeks.
- Counter-trend rally very likely to continue as it follows a steady 12-week decline.
- Good upside potential as resistance of rising trend line is quite a ways higher and key potential resistance areas are from roughly 120 pips to 700 pips away.
- Watch for how retracements develop for keys to underlying strength as the new “potential” uptrend develops.