
Previous Story
Elliott Wave analysis of Ethereum for 18/03/2019
Technical market overview:
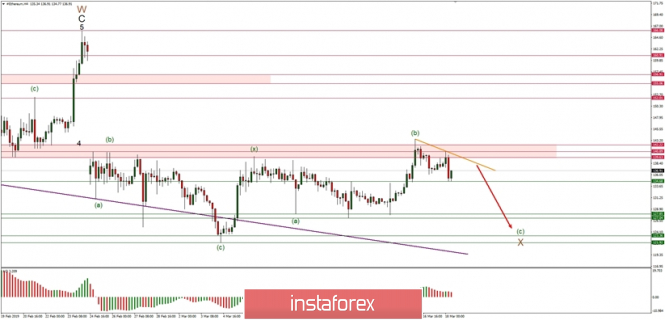
The ETH/USD pair has failed to rally above the technical resistance zone located between the levels of 139.63 – 142.22 despite the new local high was made at the level of 143.51. The top for the wave (b) has been made and the bears took control over the market. The first technical support at the level of 134.68 has already been tested, but this is not the end of the down move as the wave (c) is still being made. The next target is seen at the level of 127.85.
Weekly Pivot Points:
WR3 – 162.50
WR2 – 153.11
WR1 – 146.18
Weekly Pivot – 134.66
WS1 – 129.36
WS2 – 120.05
WS3 – 112.99
Trading recommendations:
The bearish wave progression to the downside has still not been completed, so only sell orders should be placed as close as possible to the level of 140.89 with a target seen at the level of 134.89 and if this level is violated – at 127.85.
The material has been provided by InstaForex Company – www.instaforex.com


