Previous Story
GBPUSD TECHNICAL ANALYSIS 2nd – 8th June 2016.

Author: Praveen Bharadwaj, participant of the Analyst Contest
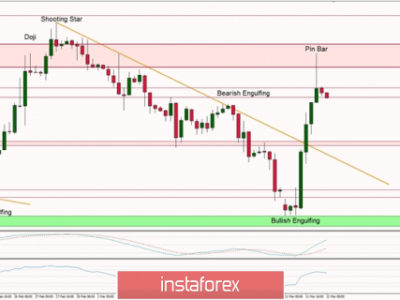
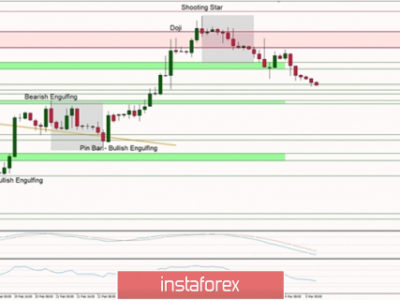
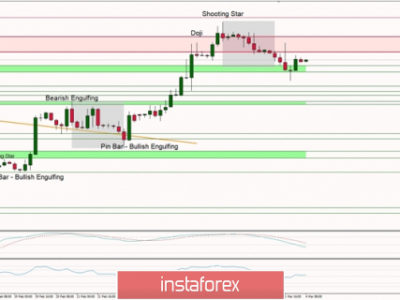
GBPUSD has been trading in a 1.47 – 1.43 range with these levels being key support and resistance throughout May. On 31st May the pair tested the 1.47 and dropped below 1.45.The 200 SMA (red line) is providing dynamic resistance at 1.47. The 100 SMA (blue line) has a support at 1.43 which has been holding. These two dynamic levels provided by the moving averages are same as the levels which the market has tested before. A confirmed close below 1.43 will be a bearish signal and the price will go all the way to 1.40 which is another major support and also a psychological level. An important thing to be noted is the U.S Non-Farm Payrolls to be announced on 3rd June, creating high volatility in this pair. And on other side, if a bullish supportive candle occurs at 1.43, the price will go back all the way to 1.47 again. A valid close could establish the following trade setups which might occur after the NFP data release.
Possible trade setups:
Short at 1.4250 after getting a strong bearish candle (daily close) below 1.4300. The target is 1.4050 which is a major support. Exit/stop loss at 1.4450.
Go long at 1.4400 if a bullish supportive candle (daily close) occurs at 1.43 support. The target is 1.4600 which is near to the major resistance which has been holding. Exit/stop loss at 1.4200.