Technical analysis for Gold for February 26, 2019
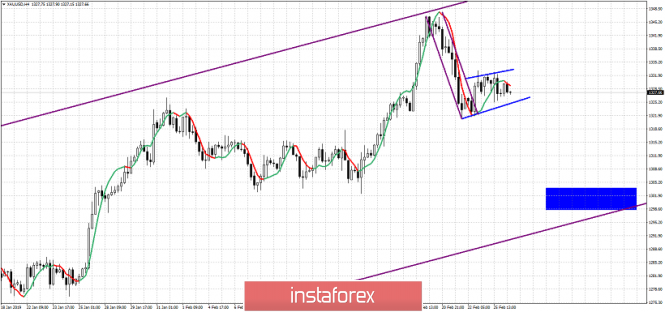
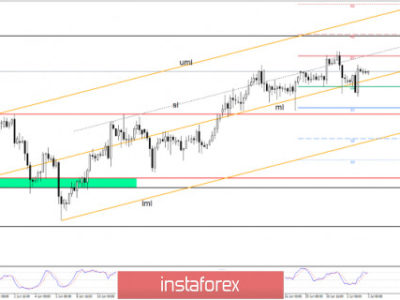
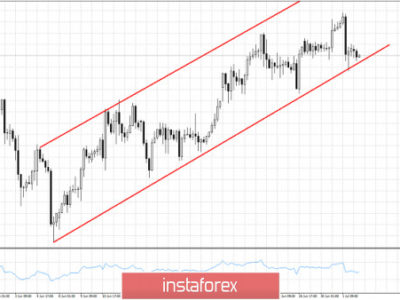
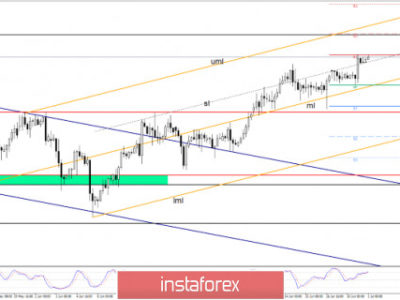
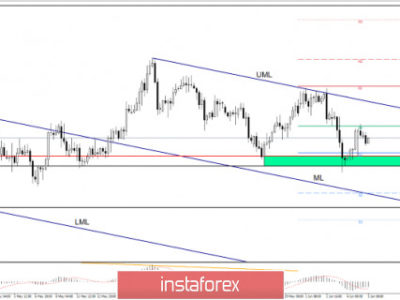
Gold continues to trade just above the break out area of $1,326. Current price action in Gold implies that more downside is more probable than a move to new highs. Gold price might be forming a bear flag.
Purple lines – bullish channel
Blue rectangle – bear flag target
Blue lines – bear flag
Gold price got rejected at the upper channel boundary as expected and pulled back towards $1,326-30 which was our short-term target. Support is found at $1,321-23 and resistance at $1,333. If Gold breaks support we should expect prices to move towards the lower boundary of the bullish channel towards the next major support at $1,300. Breaking above resistance at $1,333 will put recent highs to the test.
The material has been provided by InstaForex Company – www.instaforex.com

