Previous Story
Technical analysis of NZD/USD for May 01, 2019
Overview:
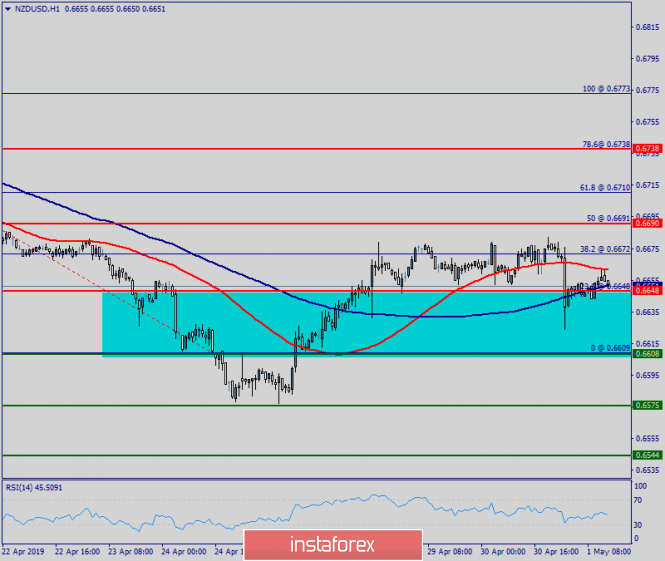
The NZD/USD pair is showing signs of weakness following a breakout of the lowest level of 0.6648. On the H1 chart. the level of 0.6648 coincides with 23.6% of Fibonacci, which is expected to act as minor support today. Since the trend is below the 23.6% Fibonacci level, the market is still in a downtrend. But, major resistance is seen at the level of 0.6690. Furthermore, the trend is still showing strength above the moving average (100). Thus, the market is indicating a bearish opportunity below the above-mentioned support levels, for that the bearish outlook remains the same as long as the 100 EMA is headed to the downside. Therefore, strong resistance will be found at the level of 0.6690 providing a clear signal to buy with a target seen at 0.6575. If the trend breaks the minor resistance at 0.6575, the pair will move downwards continuing the bearish trend development to the level 0.6544.
The material has been provided by InstaForex Company – www.instaforex.com