
Previous Story
Trading plan for 17/03/2017
Posted On 17 Mar 2017
Comment: 0
Trading plan for 17/03/2017:
There is one important macroeconomic report on Friday 17th of March that market participants will keep an eye on during the American trading session. It is the Preliminary University of Michigan Consumer Sentiment Indicator data.
EUR/USD analysis for 17/03/2017:
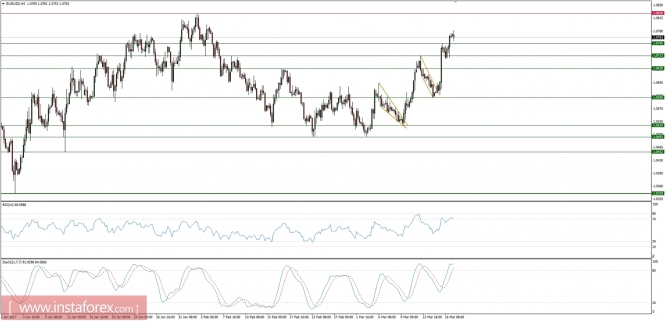
The Preliminary UoM Consumer Sentiment Indicator data are scheduled for release at 02:00 pm GMT and market participants expect the data will beat the last month figure of 96.3 by printing 97.1 figure. The sentiment might increase higher mainly due to a series of very good results from the U.S. jobs market. Nevertheless, the index is currently close to its previous highs and now might start to reverse towards the mean. The momentum may carry the index higher from here, but the top is close, which is why the current data release might be hard to trade. It sounds reasonable to assume that both the nominal data and expectations might be tumbling soon.
Let’s now take a look at the EUR/USD technical picture in the H4 time frame. The market is trading in overbought conditions after the surprising reaction to the FED interest rate hike, so now some kind of the corrective move should be developed. If the data are worse than expected, then the market might test the technical support at the level of 1.0745 and even 1.0713. The growing bearish divergence supports this view.
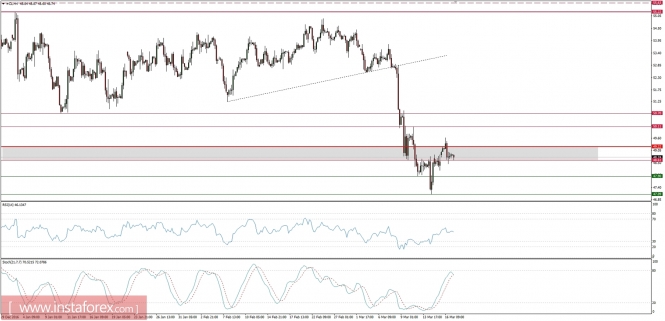
Market snapshot – Crude Oil break out above the resistance
The oil bulls have managed to push the price higher towards the technical resistance zone between the levels of 48.61 – 49.22, but the price was capped after making a top at the level of 49.61. Currently, the price got back to the gray resistance zone and the overbought trading conditions might suggest it will retrace even lower towards the next technical support at the level of 47.90.
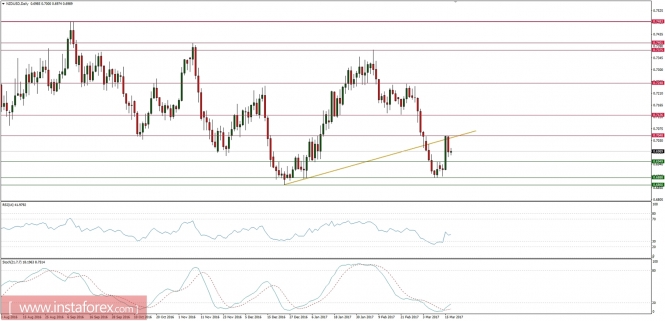
Market snapshot – NZD/USD capped at trend line resistance
The price of NZD/USD has tested the golden trend line resistance on the daily chart, but the level was clearly rejected. Nevertheless, it looks like the oversold trading conditions might help the bull camp to try to test the level again soon and break out towards the next technical resistance at the level of 0.7126.
The material has been provided by InstaForex Company – www.instaforex.com
Source:: Trading plan for 17/03/2017


