
Previous Story
EUR/USD: plan for the European session on August 6, 2019
To open long positions on EURUSD you need:
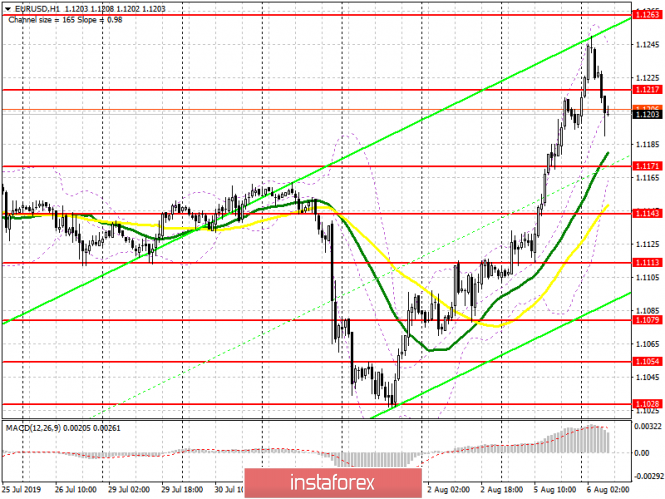
The euro continued to grow after weak reports on the US economy, especially after a decrease in the activity of the index for the non-manufacturing sector of the United States. At the moment, during the Asian session, the bulls have reached the next major resistance level of 1.1248, to which I highlighted, which led to a slowdown. The primary task of buyers will be to return and consolidate above the intermediate resistance of 1.1217, which will lead to a repeated wave of growth and update highs of 1.1263 and 1.1289, where I recommend taking profits. However, a more acceptable option for buying EUR/USD will be the formation of a false breakdown in the region of a low of 1.1171, or a test of a larger support 1.1143, where a new lower boundary of the current ascending channel will be formed.
To open short positions on EURUSD you need:
Yesterday, sellers tried to keep the euro from growing above the major resistance of 1.1187, but retreated from the second attempt, which led to further strengthening of the pair. At the moment, a good signal to open short positions will be the formation of a false breakdown in the resistance zone 1.1217, which was formed today during the Asian session, which will maintain a downward momentum and will lead to an update of larger support levels of 1.1171 and 1.1143, at which euro buyers will again show themselves . If in the morning the bulls break above a resistance of 1.1217, then in this case it is best to look for short positions by rebounding from a new high of 1.1263, or slightly higher – from a resistance of 1.1289. Given that important fundamental statistics are not published in the morning, all emphasis will again be placed on the US session.
Signals of indicators:
Moving averages
Trading is conducted above 30 and 50 moving average, which indicates an upward correction in the pair.
Bollinger bands
In case the euro decreases, the lower border of the indicator in the area of 1.1171 will provide support.
Description of indicators
- MA (moving average) 50 days – yellow
- MA (moving average) 30 days – green
- MACD: Fast EMA 12, Slow EMA 26, SMA 9
- Bollinger Bands 20
The material has been provided by InstaForex Company – www.instaforex.com


