
Previous Story
EUR/USD: plan for the European session on Dec 10, 2019
To open long positions on EURUSD you need:
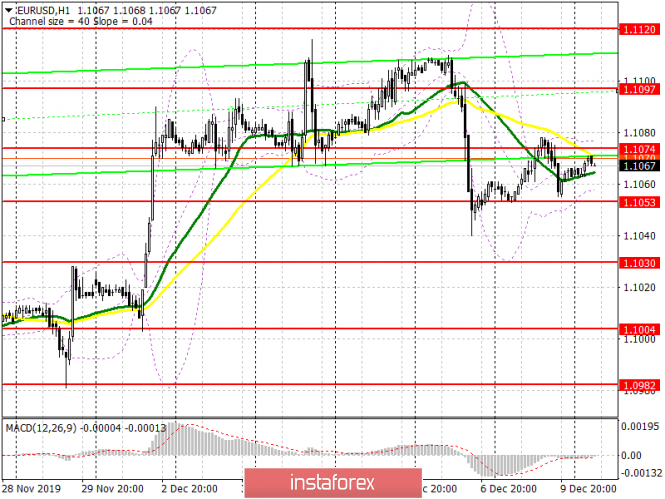
Yesterday’s data on Germany made it possible for the euro to make an attempt to grow, which ended with another sale, which kept the pair in the side channel, since important reports were not released in the afternoon. Apparently, trade will again become restrained before the final meetings of central banks this year. Currently, buyers of the euro need a refund and consolidation at the level of 1.1074, since it depends on it whether the downward movement will continue or not. If bulls fail to do this in the morning, then it is best to postpone purchases until a false breakout is formed in the support area of 1.1053, but it is best to buy EUR/USD immediately to rebound from a low of 1.1030. A break and consolidation of the euro above the resistance of 1.1073, together with good data on the volume of industrial production in the eurozone countries and increased confidence in the business environment, will lead to a larger upward correction and the pair return to the highs of 1.1097 and 1.1120, where I recommend profit taking.
To open short positions on EURUSD you need:
Bears need to again form a false breakout in the resistance area of 1.1073, which will be the first signal to open short positions in the euro, and weak data on the eurozone will help pull down the pair further into the support area of 1.1053. However, a breakout of this low is more important, which will raise the pressure on the pair and allow sellers to reach the levels of 1.1030 and 1.1004, where I recommend profit taking. If the bears miss the level of 1.1073 in the morning, then do not rush to open short positions, since the demand for the euro will significantly increase. It is best to wait for an update of the resistance at 1.1097, or sell immediately for a rebound from the high of 1.1120.
Signals of indicators:
Moving averages
Trading is slightly lower than the 30 and 50 moving average, which can lead to further downward correction in the pair.
Bollinger bands
In case the euro falls further, support will be provided by the lower boundary of the indicator, located in the region of 1.1060, the break of which will raise pressure on the pair. Growth above the upper boundary of the indicator in the region of 1.1070 will lead to a more powerful upward momentum.
Description of indicators
- Moving average (moving average determines the current trend by smoothing out volatility and noise). Period 50. The graph is marked in yellow.
- Moving average (moving average determines the current trend by smoothing out volatility and noise). Period 30. The graph is marked in green.
- MACD indicator (Moving Average Convergence / Divergence – moving average convergence / divergence) Fast EMA period 12. Slow EMA period 26. SMA period 9
- Bollinger Bands (Bollinger Bands). Period 20
The material has been provided by InstaForex Company – www.instaforex.com


