
Previous Story
EUR/USD: plan for the European session on Feb 21, 2020
To open long positions on EURUSD you need:
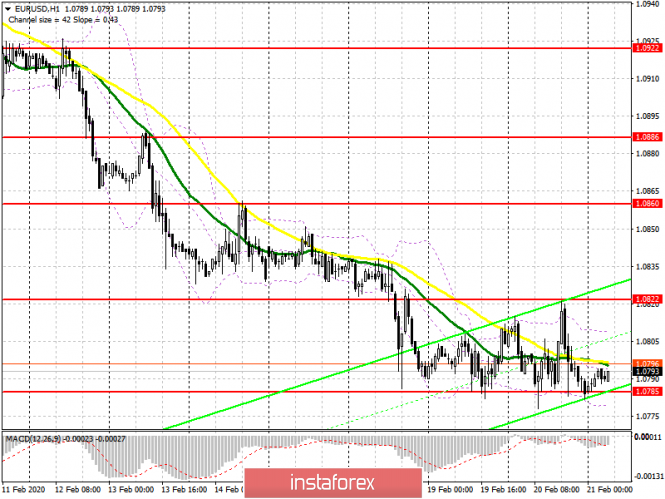
Yesterday, the minutes of the European Central Bank helped the euro stay in the region of annual lows, but the downward movement did not stop because of the active struggle of buyers for the level, but due to the temporary absence of those wishing to sell the pair at current lows. At the moment, the bulls are focused on support in the area of 1.0785, the update of which was about six times, but there were no people who wanted to open new long positions. It is possible that the fundamental statistics that are released today on the PMI indices for the manufacturing and service sectors will help the bulls form another false breakout and return to the high of 1.0822, where I recommend taking profits. However, given the current state of the manufacturing sector, one can hardly count on good performance. Only a breakthrough of 1.0822 will lead to the formation of a larger upward correction to the area of highs 1.0860 and 1.0886. In the scenario of a breakthrough of support at 1.0785 in the morning, it is best to open long positions in euros after updating the lows of 1.0765 and 1.0740, however, with the current bear market, you will be very careful with finding the low.
To open short positions on EURUSD you need:
Bears continue to bend their line, and are waiting for the next weak fundamental data on the state of the European economy, which can be published today in the morning. A break of support of 1.0785 will bring EUR/USD to the area of new annual lows 1.0765 and 1.0740, where I recommend taking profits. However, be careful with selling the euro at current lows, especially the breakout, since a bullish correction could form at any time. In case the pair grows in the morning, only the formation of a false breakout in the area of 1.0822 will be a signal to open short positions in euros. I recommend selling immediately on the rebound only after a test of a high of 1.0860.
Signals of indicators:
Moving averages
Trading is carried out in the region of 30 and 50 moving average, which indicates another attempt by euro buyers to form an upward correction.
Bollinger bands
A break of the lower boundary of the indicator at 1.0775 will cause the euro to fall.
Description of indicators
- Moving average (moving average determines the current trend by smoothing out volatility and noise). Period 50. The graph is marked in yellow.
- Moving average (moving average determines the current trend by smoothing out volatility and noise). Period 30. The graph is marked in green.
- MACD indicator (Moving Average Convergence / Divergence – Moving Average Convergence / Divergence) Fast EMA period 12. Slow EMA period 26. SMA period 9
- Bollinger Bands (Bollinger Bands). Period 20
The material has been provided by InstaForex Company – www.instaforex.com


