
Previous Story
EUR/USD: plan for the European session on March 19, 2020
To open long positions on EURUSD, you need:
The European currency slumped amid a sharp demand for safe-haven assets, which led to a test of the low in the 1.0805 area, which I drew attention to in my yesterday’s forecast. The decision of the European Central Bank to expand its bond purchase program to 750 billion euros supported the single currency by the end of the day and now the bulls need more active actions to continue the upward correction. First of all, it is better to look at long positions after moving down to the support area of 1.0860, provided that a false breakout is formed there. Buy the euro immediately on the rebound, with a small stop order under yesterday’s low, you can from the level of 1.0822, where the bulls will try to form a new lower boundary of the ascending channel. An equally important goal for buyers will be a breakout and consolidation above the resistance of 1.0909, which will lead to a sharper rise to the high of 1.0975, where another sale was observed yesterday, as well as, quite likely, to the resistance test of 1.1041, where I recommend taking profits.
To open short positions on EURUSD, you need:
Bears don’t have much to worry about yet. A small correction after a major two-day collapse of the euro occurred by itself. At the moment, the initial task will be to form a false breakout in the resistance area of 1.0909, which will be a signal to open short positions in the expectation of a repeated decline and update of the lows of 1.0860 and 1.0822, where I recommend taking profits, since euro buyers may be active in this range. If there is no surge in volume in the area of 1.0822, the pair will most likely continue to fall to the levels of 1.0780 and 1.0740. The absence of important fundamental statistics may lead to a continuation of the upward correction. In this case, it is best to return to short positions in EUR/USD on the rebound from the high of 1.0975, or even higher in the area of a major resistance of 1.1041.
Indicator signals:
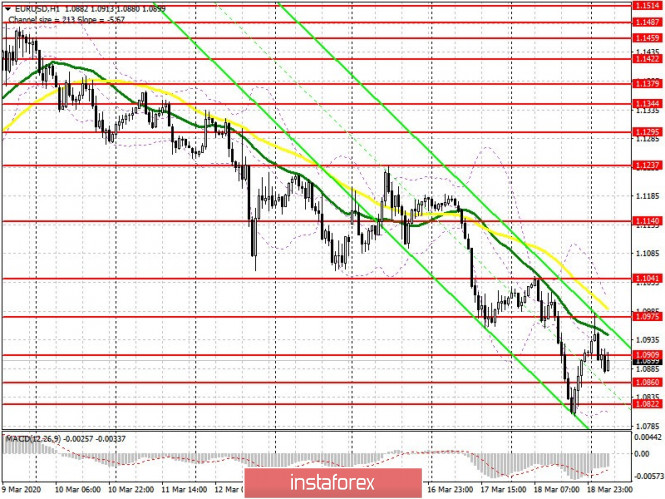
Moving averages
Trading is conducted below 30 and 50 moving averages, which keeps the probability of a further downward trend in the pair.
Bollinger Bands
In case the euro falls, the lower boundary of the indicator around 1.0820 will provide support, while the growth may be limited by the upper level of the indicator in the area of 1.1000.
Description of indicators
- Moving average (moving average determines the current trend by smoothing out volatility and noise). Period 50. The graph is marked in yellow.
- Moving average (moving average determines the current trend by smoothing out volatility and noise). Period 30. The graph is marked in green.
- MACD indicator (Moving Average Convergence / Divergence – moving average convergence / divergence) Fast EMA period 12. Slow EMA period 26. SMA period 9
- Bollinger Bands (Bollinger Bands). Period 20
The material has been provided by InstaForex Company – www.instaforex.com


