GBP/USD. April 01, 2019
4-hour timeframe
Technical details:
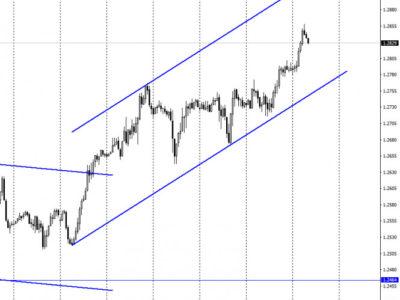
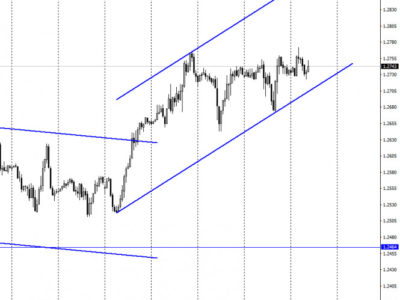
The upper linear regression channel: direction – up.
The lower linear regression channel: direction – sideways.
Moving average (20; smoothed) – down.
CCI: -73.5422
The GBP/USD currency pair began to adjust after the collapse last week. As for the prospects of the pound sterling, there is a new date for it X – April 12. On this day, the UK officially has to leave the EU in a “hard” scenario. But there are several “but”. First, the UK together with the EU can postpone the release dates again. Then Britain will have to participate in the elections to the European Parliament, but these are trifles. Secondly, in theory, the British Parliament can vote for Theresa May’s “deal” at least every day. It would not be more absurd than three rejections of the same agreement. Thus, three full months of 2019 have passed, and “things are still there”. We still believe that in the current conditions, there is only one way at the pound sterling – down. More questions are raised by the fact why the pound is not lower than 1.2500? Perhaps market participants are still hoping that the parties (London and Brussels) will still be able to avoid a “tough divorce.” However, the chances of this option are melting every day. There were also rumors that a new series of dismissals of ministers disagreeing with the policy of Theresa May could follow in the British Parliament. In addition, there is information that Theresa May is under pressure from the “tough” Brexit scenario.
Nearest support levels:
S1 – 1.3000
S2 – 1.2939
S3 – 1.2878
Nearest resistance levels
R1 – 1.3062
R2 – 1.3123
R3 – 1.3184
Trading recommendations:
The pair GBP/USD has started an upward correction. Since the trend is downward, traders are advised to wait for the color of 1-2 bars in blue and trade again for a fall with targets at 1.3000 and 1.2939.
Long positions will become relevant only after overcoming the moving average by traders. In this case, the tendency for the instrument to change again is upward, but from a fundamental point of view, there is little reason for this option.
In addition to the technical picture should also take into account the fundamental data and the time of their release.
Explanations for illustrations:
The upper linear regression channel is the blue lines of the unidirectional movement.
The lower linear channel is the purple lines of the unidirectional movement.
CCI is the blue line in the indicator regression window.
The moving average (20; smoothed) is the blue line on the price chart.
Murray levels – multi-colored horizontal stripes.
Heikin Ashi is an indicator that colors bars in blue or purple.
The material has been provided by InstaForex Company – www.instaforex.com

