
Previous Story
GBP/USD: plan for the European session on Apr 2, 2020
To open long positions on GBP/USD, you need:
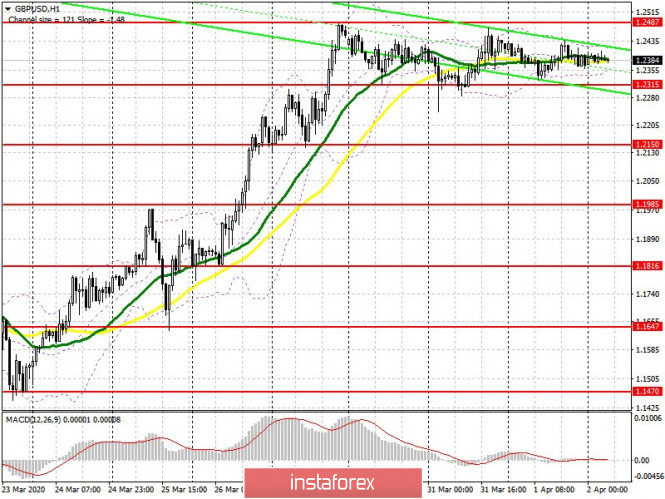
Nothing has changed from a technical point of view. The bulls managed to protect the 1.2315 support yesterday, which keeps the market on their side. Now trading is conducted in the middle of the channel, and I do not recommend taking any actions from there. While the pair is above the 1.2315 area, we can expect continued growth of GBP/USD in the resistance area of 1.2487, the breakout of which will provide a direct path to the highs of 1.2605 and 1.2686, where I recommend taking profits. In the scenario of a correction of the pound to the level of 1.2315, you do not need to rush to open long positions. It is best to wait for the support test of 1.2150, or buy immediately for a rebound from the low of 1.1985. Given that the release of important fundamental statistics on the UK economy is not planned for today, most likely in the first half of the day, trading will take place in a side channel.
To open short positions on GBP/USD, you need:
Sellers of the pound have already approached the support of 1.2315 four times, but they have not managed to break below this range. Bears need to try to return the market under their control, and to do this, it is necessary to consolidate below the 1.2315 level, which will lead to a larger sell-off of GBP/USD to the area of the lows of 1.2150 and 1.1985, where I recommend taking profits. The 1.1985 support test will also indicate the resumption of the bear market. In case bulls attempt to regain the upward trend, the formation of a false breakout in the resistance area of 1.2487 will be the first signal to open short positions. Otherwise, it is best to sell the pound on a rebound from the highs of 1.2605 and 1.2686.
Signals of indicators:
Moving averages
Trade is conducted in the region of 30 and 50 moving average, which indicates the lateral nature of the market.
Note: The period and prices of moving averages are considered by the author on the hourly chart H1 and differs from the general definition of the classic daily moving averages on the daily chart D1.
Bollinger bands
Volatility has decreased, which does not provide signals for entering the market based on the indicator.
Description of indicators
- Moving average (moving average determines the current trend by smoothing out volatility and noise). Period 50. The graph is marked in yellow.
- Moving average (moving average determines the current trend by smoothing out volatility and noise). Period 30. The graph is marked in green.
- MACD indicator (Moving Average Convergence / Divergence – moving average convergence / divergence) Fast EMA period 12. Slow EMA period 26. SMA period 9
- Bollinger Bands (Bollinger Bands). Period 20
The material has been provided by InstaForex Company – www.instaforex.com


