
Previous Story
GBP/USD: plan for the European session on Mar 2, 2020
To open long positions on GBP/USD you need:
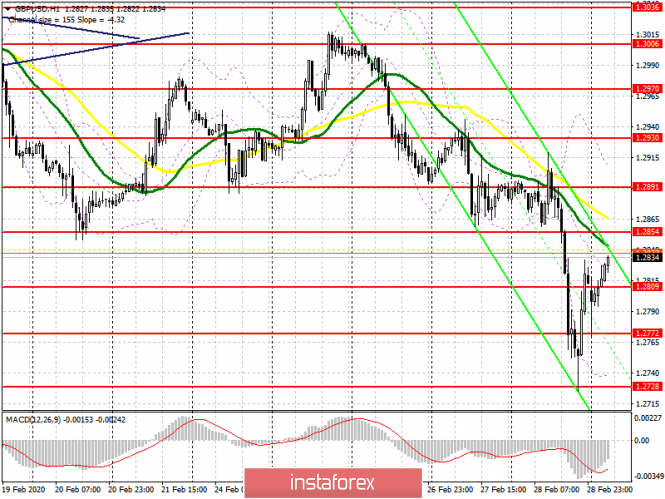
The British pound underwent a sell off on Friday amid the start of trade talks between the UK and the EU, but the bulls quickly bought the lows, not allowing a major decline to end the day lower. Currently, buyers of the British pound will be counting on long positions after a good correction down. In the morning, the formation of a false breakdown in the region of 1.2809, or a support test of 1.2772 will signal the opening of long positions. In the region of 1.2770, the lower boundary of the new rising channel can also form. An equally important task for the bulls will be to break and consolidate above the resistance of 1.2854, which will increase the demand for the pound and lead to the renewal of the highs of 1.2891 and 1.2930, where I recommend taking profits. However, the upside potential of the pound is limited by moving averages, indicating the formation of a bear market.
To open short positions on GBP/USD you need:
Today it is best to sell the pound after a false breakout has formed in the resistance area of 1.2854, slightly higher than which the moving averages go. However, larger bears will probably prefer to act on the resistance of 1.2891, where the upper boundary of the new descending channel will form. A bear’s priority will be to break through and consolidate below the support of 1.2809, which will increase the pressure on the pair and lead to the renewal of the lows 1.2772 and 1.2728, where I recommend taking profits. It should be understood that the start of trade talks in any case will be negative for the pound, since neither side wants to make concessions on the terms.
Signals of indicators:
Moving averages
Trading is carried out below 30 and 50 moving average, which saves the likelihood of continued downward correction. The averages also play the role of resistance.
Bollinger bands
Growth will be limited by the upper level of the indicator in the area of 1.2900, from where you can sell immediately for a rebound. Support will be provided by the lower boundary of the indicator in the region of 1.2740, from where you can buy immediately for a rebound.
Description of indicators
- Moving average (moving average determines the current trend by smoothing out volatility and noise). Period 50. The graph is marked in yellow.
- Moving average (moving average determines the current trend by smoothing out volatility and noise). Period 30. The graph is marked in green.
- MACD indicator (Moving Average Convergence / Divergence – moving average convergence / divergence) Fast EMA period 12. Slow EMA period 26. SMA period 9
- Bollinger Bands (Bollinger Bands). Period 20
The material has been provided by InstaForex Company – www.instaforex.com


