Previous Story
GBP/USD technical analysis for 19/02/2019
GBP/USD technical analysis for 19/02/2019:
The battle of the resistance was won by bears so far.
Technical market overview:
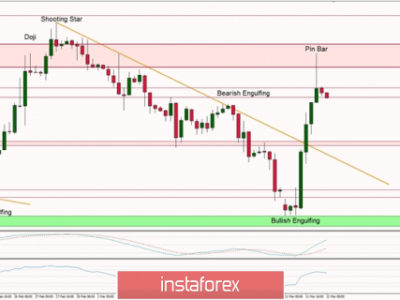
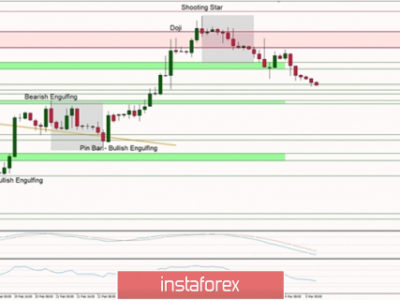
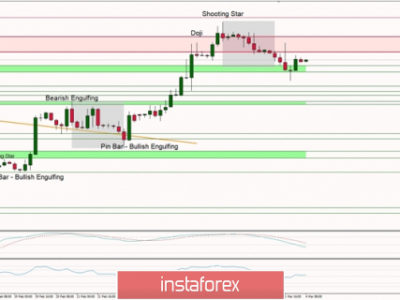
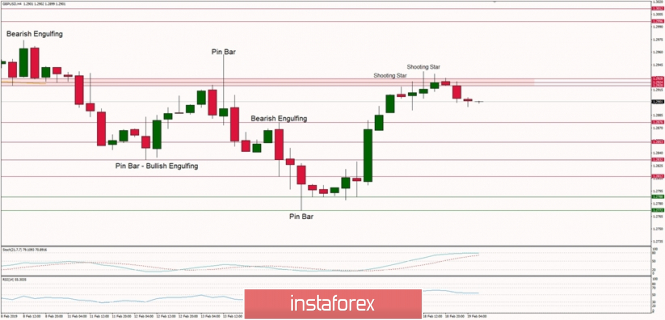
In the GBP/USD market, the bulls have managed to test the key technical resistance zone located between the levels of 1.2920 – 1.2928, they even manage to break through it but the Shooting Stars candlestick patterns were made and the price has been slowly going down since then. The local high was made at the level of 1.2937, but the candle has closed below the technical resistance anyway. The market conditions are now overbought and despite the positive momentum the price might now pull-back. The nearest technical support is seen at the level of 1.2876.
Weekly Pivot Points:
WR3 – 1.3163
WR2 – 1.3061
WR1 – 1.2979
Weekly Pivot – 1.2879
WS1 – 1.2794
WS2 – 1.2689
WS3 – 1.2606
Trading recommendations:
All sell orders opened from the level of 1.2920 should still be in play as the first target for them is seen at the level of 1.2876. The second target is seen at the level of 1.2853 and third at 1.2832. No new long-term sell orders should be opened yet.
The material has been provided by InstaForex Company – www.instaforex.com