
Previous Story
Overview of EUR/USD on August 12, 2019
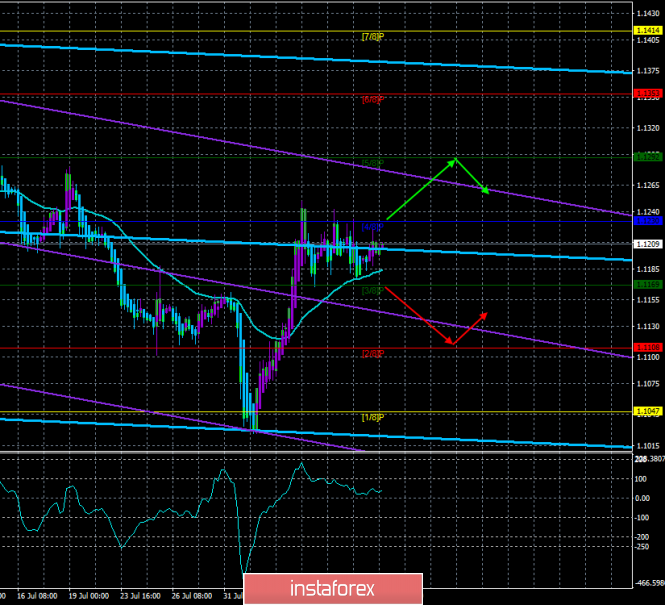
4-hour timeframe
Technical data:
The upper linear regression channel: direction – down.
The lower linear regression channel: direction – down.
The moving average (20; smoothed) – up.
CCI: 51.6315
The new trading week starts as the previous one ended. Flat on the EUR/USD pair is maintained, and above the Murray level of “4/8” – 1.1230, the bulls are unable to leave. Neither at the end of last week nor at the beginning of the current, any news and macroeconomic statistics were available to traders and are not expected. Thus, there is a high probability that there will be low volatility and lateral movement today. We will have to wait at least for tomorrow when the consumer price indices in Germany and the States will be published. However, the question is more important now: what is the strength of the bulls, will it be enough to continue strengthening the euro, against the background of almost zero fundamental backgrounds? We believe that despite overcoming the moving average line, the downward trend on the euro/dollar pair remains. In favor of this, they immediately say 3 rebounds from the Murray level of “4/8”, as well as the lack of an update of the level of 1.1283, from which the price previously bounced three times. Thus, to overcome the Murray level of “4/8” to buy a pair is impractical. And in the case of consolidation of the euro/dollar pair below the moving average, the trend will again fall into the hands of bears. Tomorrow’s publication of inflation in the US may support the demand for the dollar, as it is expected to accelerate to 1.7% y/y.
Nearest support levels:
S1 – 1.1169
S2 – 1.1108
S3 – 1.1047
Nearest resistance levels:
R1 – 1.1230
R2 – 1.1292
R3 – 1.1353
Trading recommendations:
The foreign exchange market is preparing for new sales of the euro and purchases of the dollar, but you need to wait for the overcoming of the moving. The target for short positions – 1.1108. It is recommended to buy the pair if the bulls still manage to gain a foothold above the Murray level of “4/8” – 1.1230, with a target of 1.1292.
In addition to the technical picture should also take into account the fundamental data and the time of their release.
Explanation of illustrations:
The upper linear regression channel – the blue line of the unidirectional movement.
The lower linear regression channel – the purple line of the unidirectional movement.
CCI – the blue line in the indicator window.
The moving average (20; smoothed) – blue line on the price chart.
Murray levels – multi-colored horizontal stripes.
Heiken Ashi is an indicator that colors bars in blue or purple.
The material has been provided by InstaForex Company – www.instaforex.com


