
Previous Story
Technical analysis for Gold for February 22, 2019
Gold price as expected has reversed and is pulling back towards previous resistance of $1,326 now support. Gold price should find support at current levels. Falling below $1,320 and closing the week lower than $1,326 would create a bearish reversal candlestick pattern in the weekly chart.
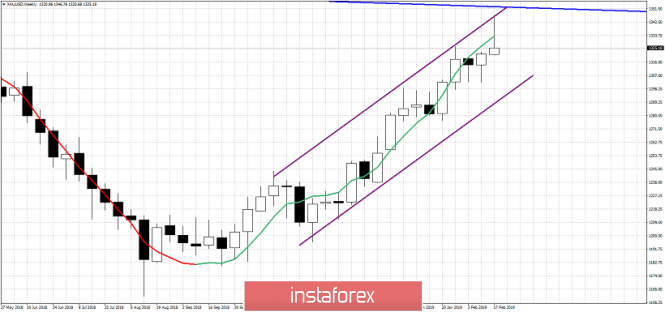
Purple lines – bullish channel
Blue line – long-term resistance trend line
Gold price remains inside the bullish channel. Medium-term trend remains bullish as long as price is above $1,300. However price has reached very close to our longer-term target of $1,350 and has also reached the upper channel boundary. As I explained in our previous posts, a rejection at $1,340 would lead to at least a pull back towards $1,330-26 area which was previous resistance and now support. The weekly candle if we close at current levels or lower will be a bearish reversal hammer pattern. If this is the case and next week we see more weakness in Gold prices, then a major top could already be in. Closing today above $1,330 and closer to $1,340, could signal more upside coming next week towards $1,350-60.
The material has been provided by InstaForex Company – www.instaforex.com


