Previous Story
Technical analysis for NZD/USD for January 24, 2019
Technical outlook:
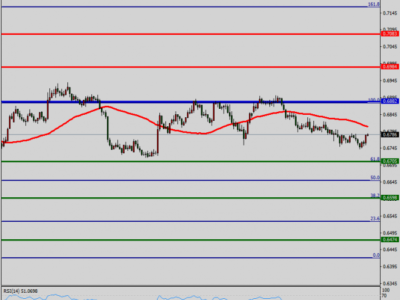
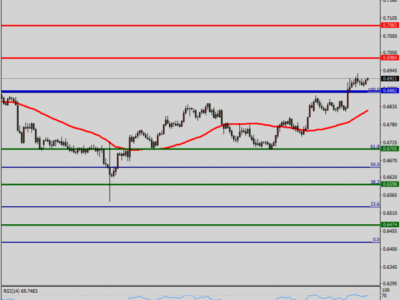
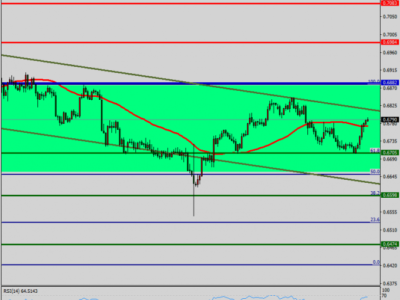
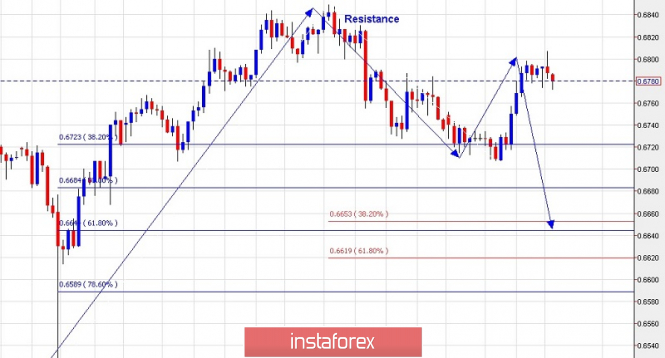
We have presented the 4H chart view for NZD/USD with a simple probable wave structure, to have a short to medium-term directional outlook. As seen here, the recent boundary which is being worked out is between 0.6520 and 0.6850 levels respectively. The NZD/USD pair had dropped to the fibonacci 0.618 support of the above rally, as seen here on January 22, 2019. The subsequent rally has stalled at a fibonacci 0.618 resistance of the recent drop between 0.6850 and 0.6707 levels respectively, which is not shown here. A continued bearish reversal from here could bring down prices to 0.6550 levels, which is also converging with the fibonacci 0.618 support of the previous swing rally as depicted here in Red and Blue. We can expect this short-term drop towards 0.6550 levels before NZD/USD could turn higher again. On the flip side, please be watchful for a potential support around the 0.6730/40 levels.
Trading plan:
Short now @ 0.6780/90, stop at 0.6850, target around 0.6550
Good luck!
The material has been provided by InstaForex Company – www.instaforex.com
Source:: Technical analysis for NZD/USD for January 24, 2019