
Previous Story
Technical analysis of the GBP/USD pair for the week of Mar 30, 2020 to April 4, 2020
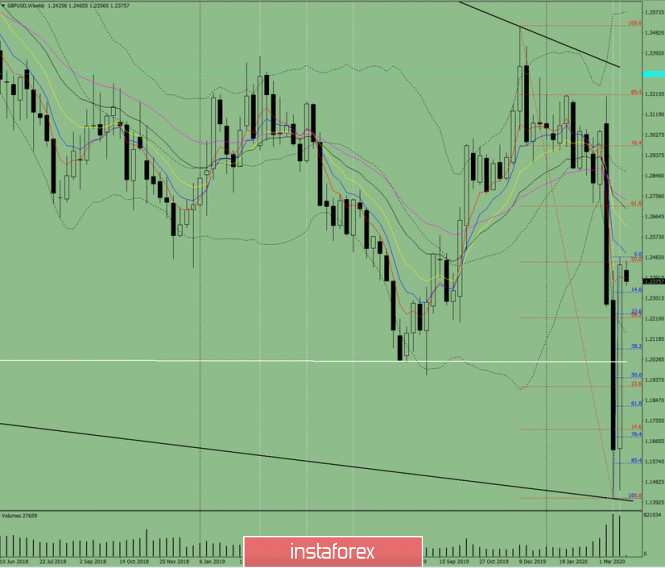
Trend analysis:
This week, the price from the level of 1.2449 (closing of the last weekly candle) will move down with the first lower target 1.2230 – a pull back level of 23.6% (blue dashed line), and if this line is reached – further work down with a target of 1.2074 – a pullback level of 38.2% (blue dashed line).
Fig. 1 (weekly schedule).
Comprehensive analysis:
– indicator analysis – down;
– Fibonacci levels – down;
– volumes – down;
– candlestick analysis – up;
– trend analysis – up;
– Bollinger lines – down;
– monthly chart – down.
The conclusion of a comprehensive analysis is a downward movement.
The overall result of calculating the candle of the GBP / USD currency pair according to the weekly chart: the price of the week will most likely have a downward trend with the absence of the first upper shadow of the weekly black candlestick (Monday – down) and the presence of the second lower shadow (Friday – up).
The first lower target of 1.2230 is a pullback level of 23.6% (blue dashed line) and if this line is reached, we can further work down with a target of 1.2074, which is a pullback level of 38.2% (blue dashed line).
An unlikely scenario: when moving down, from the level of 1.2230 – pullback level of 23.6% (blue dotted line), working up with the first goal 1.2710 – pullback level of 61.8% (red dotted line).
The material has been provided by InstaForex Company – www.instaforex.com
Source:: Technical analysis of the GBP/USD pair for the week of March 30 to April 4


