Previous Story
Bitcoin closes trap on bears
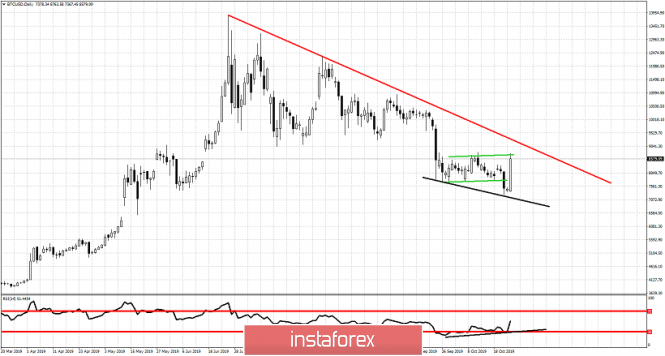
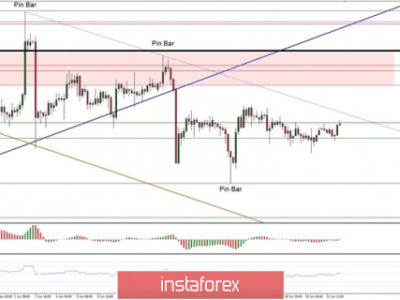
In our last analysis on Bitcoin I pointed out the bearish scenario in case price broke below $7,785. However I also pointed out that traders should be careful and keep a close eye on the RSI indicator. For a clear bearish signal we wanted not only the price to break support but the RSI to make a new low.
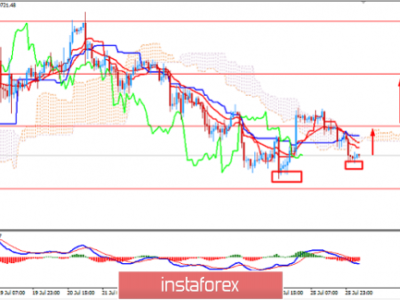
Red line – major resistance trend line
Black lines – bullish divergence
Green lines – sideways trading range
Bitcoin broke below support and moved as low as $7,250. However the RSI did not follow. This was a clear bullish divergence. We warned that something like this could happen and to be very careful. Price reversed sharply as BTCUSD is now trading near the upper trading range boundary which is important support. Was this fake break down a trap for bears? As long as price is below the red trend line resistance bears remain in control of the longer-term trend.
The material has been provided by InstaForex Company – www.instaforex.com
Source:: Bitcoin closes trap on bears